
JetBlue Airways stock: Strong technical signals and EPS miss drive 3.86% rise

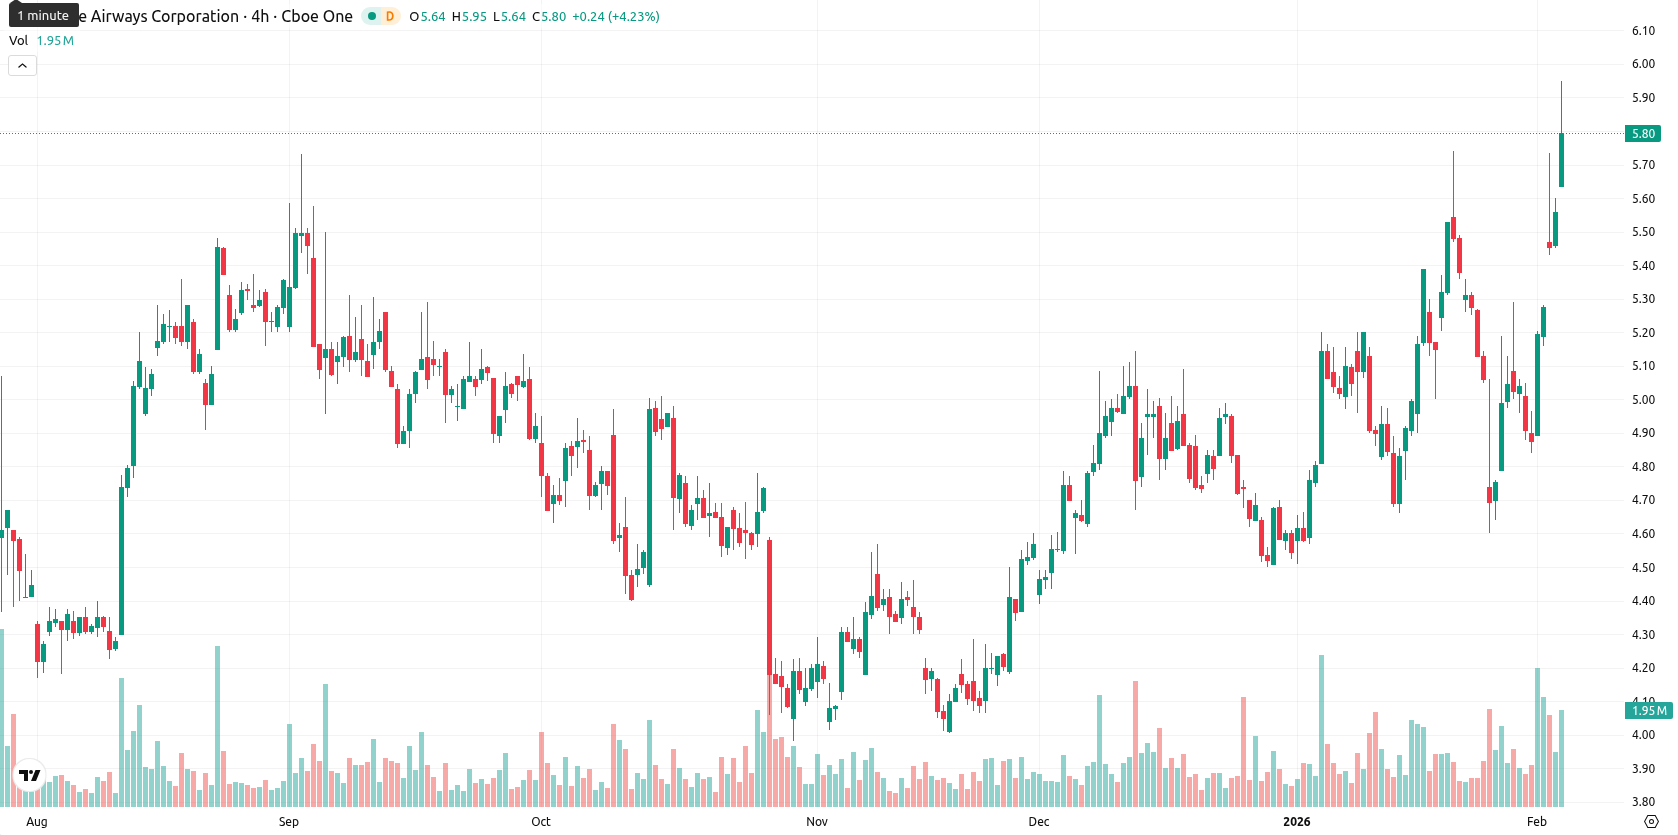
JetBlue Airways Corp (JBLU) is trading at $5.79, well above the MA-20 ($5.11), MA-50 ($4.85), and MA-200 ($4.70), which indicates strengthening short-, medium-, and long-term bullish momentum.
Highlights
- JetBlue Airways posted a Q4 2025 EPS loss of -$0.49, missing expectations, though revenue exceeded forecasts at $2.24 billion.
- The airline announced a new interline agreement with Contour Airlines, enabling customers to book combined itineraries and benefit from integrated ticketing and baggage services.
- JBLU is trading at $5.79, above key moving averages, with resistance at $6.05; technical signals point to strong bullish momentum and possible short-term upside.
Earnings miss offset by revenue beat and new partnership driving sentiment
JetBlue Airways reported its fourth-quarter 2025 earnings, posting an EPS of -$0.49 that missed expectations, while revenue topped forecasts at $2.24 billion. The airline also established a new interline agreement with Contour Airlines, allowing customers to book combined itineraries with integrated ticketing and checked baggage services.
Support holds while momentum signals strength amid overbought warnings
The nearest dynamic support for JBLU is at the Ichimoku Kijun level ($5.13), while the next resistance can be found just above the MA-50 and near the next round level at $6.00. Momentum signals are supportive with both MACD and RSI indicating a "Buy", and the daily ADX reading at 16.86 points to a developing but moderate trend. Despite CCI and Bull/Bear Power signaling overbought conditions and a tilt toward buyer dominance, Stochastic RSI reads neutral while flagging overbought conditions on higher timeframes, suggesting the risk of short-term consolidation or pullback. Today's session showed a slight upside gap from the previous close ($5.57 open vs. $5.64 today), with the current price near the upper end of the day's range ($5.64 – $5.95), reflecting moderate to high intraday volatility and persistent demand driving the stock toward session highs.
Upside favored as strong signals align with defined trading range
Over the next five trading days, JBLU is expected to move within a typical volatility band of $5.68 to $6.05, representing approximately ±4% from current levels. The probability of further price gains is high (over 80%) based on confirming "Buy" signals from most weekly indicators, including RSI, MACD, and MA-50. Sideways trading between the support at $5.68 and resistance near $6.05 is the baseline scenario. A bullish breakout above $6.05 could target higher resistance zones, while a drop below $5.68 would risk a correction toward the Ichimoku Kijun and lower moving averages.
Previously it was reported that JetBlue Airways shares are trading strongly above major moving averages, indicating a bullish trend across all timeframes, with technical signals such as MACD and RSI reinforcing positive momentum. However, overbought conditions and neutral ADX suggest that while buyers currently dominate, resistance near $6.00 may prompt short-term consolidation.


Latest JetBlue News


-
 Afghanistan
-
 Albania
-
 Algeria
-
 Angola
-
 Argentina
-
 Armenia
-
 Australia
-
 Austria
-
 Azerbaijan
-
 Bahamas
-
 Bahrain
-
 Bangladesh
-
 Belarus
-
 Belgium
-
 Bolivia
-
 Botswana
-
 Brazil
-
 Brunei
-
 Bulgaria
-
 Cambodia
-
 Cameroon
-
 Canada
-
 Chile
Chile
-
 China
China
-
 Colombia
-
 Congo
Congo
-
 Costa Rica
-
 Cote d'Ivoire
-
 Croatia
-
 Cuba
Cuba
-
 Cyprus
-
 Czechia
-
 DR Congo
-
 Denmark
-
 Dominican Republic
-
 Ecuador
-
 Egypt
Egypt
-
 El Salvador
-
 Estonia
-
 Eswatini
-
 Ethiopia
-
 Finland
-
 France
-
 Georgia
-
 Germany
-
 Ghana
Ghana
-
 Greece
-
 Haiti
Haiti
-
 Hong Kong
-
 Hungary
-
 India
India
-
 Indonesia
-
 Iran, Islamic republic
-
 Iraq
Iraq
-
 Ireland
-
 Israel
-
 Italy
Italy
-
 Jamaica
-
 Japan
Japan
-
 Jordan
-
 Kazakhstan
-
 Kenya
Kenya
-
 Korea
Korea
-
 Kuwait
-
 Kyrgyzstan
-
 Laos
Laos
-
 Latvia
-
 Lebanon
-
 Lesotho
-
 Libya
Libya
-
 Lithuania
-
 Luxembourg
-
 Madagascar
-
 Malaysia
-
 Malta
Malta
-
 Mauritius
-
 Mexico
-
 Moldova
-
 Mongolia
-
 Montenegro
-
 Morocco
-
 Mozambique
-
 Myanmar
-
 Namibia
-
 Nepal
Nepal
-
 Netherlands
-
 New Zealand
-
 Nigeria
-
 North Macedonia
-
 Norway
-
 Oman
Oman
-
 Pakistan
-
 Palestine
-
 Panama
-
 Papua New Guinea
-
 Paraguay
-
 Peru
Peru
-
 Philippines
-
 Poland
-
 Portugal
-
 Puerto Rico
-
 Qatar
Qatar
-
 Reunion
-
 Romania
-
 Rwanda
-
 Saudi Arabia
-
 Serbia
-
 Singapore
-
 Slovakia
-
 Slovenia
-
 Somalia
-
 South Africa
-
 Spain
Spain
-
 Sri Lanka
-
 Sweden
-
 Switzerland
-
 Syria
Syria
-
 Taiwan
-
 Tajikistan
-
 Tanzania
-
 Thailand
-
 Trinidad and Tobago
-
 Tunisia
-
 Turkey
-
 UAE
UAE
-
 Uganda
-
 Ukraine
-
 United Kingdom
-
United States
-
 Uruguay
-
 Uzbekistan
-
 Venezuela
-
 Vietnam
-
 Yemen
Yemen
-
 Zambia
-
 Zimbabwe
- Forex
- Crypto
