
Microsoft stock: upbeat AI results drive gains, but bearish signals persist

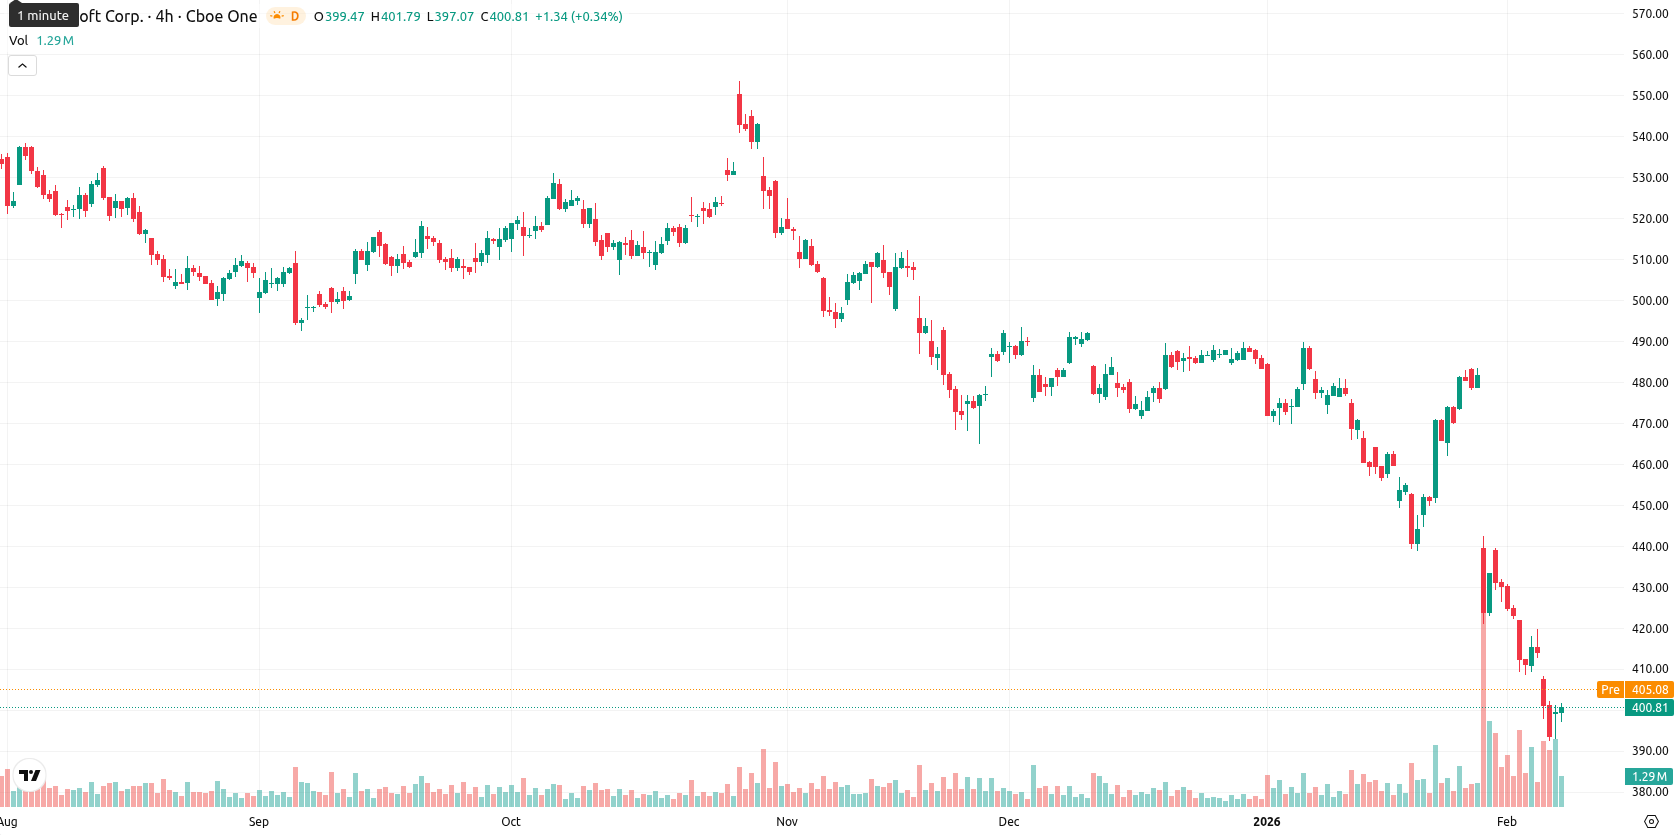
Microsoft Corporation (MSFT) is trading at $401.27, up $7.60 (1.93%) intraday, but remains well below its MA-20 ($447.96), MA-50 ($468.88), and MA-200 ($486.90) — underscoring persistent downward pressure across all timeframes.
Highlights
- Microsoft’s Q2 FY26 results beat expectations, underpinned by Azure’s 39% growth and Microsoft 365 Copilot reaching 15 million paid seats.
- The company declared a $0.91 per share dividend (ex-dividend date: February 19, 2026) and expanded its AI strategy with Broadcom custom chip development.
- Microsoft trades at $401.27, well below key moving averages, with short-term oscillators signaling oversold conditions and a projected range of $390.00–$410.00 amid sustained bearish momentum.
Cautious outlook as earnings beat contrasts with AI gains and product risks
Microsoft reported second-quarter fiscal 2026 results that beat expectations, yet sentiment remained cautious after the company declared a dividend of $0.91 per share with an ex-dividend date on February 19, 2026. Cloud business momentum continued, highlighted by Azure’s 39% growth and Microsoft 365 Copilot’s milestone of 15 million paid seats. The firm is expanding its AI strategy through custom chip development with Broadcom and has launched an investigation into Exchange Online mistakenly flagging valid emails as phishing.
Bearish momentum persists as oversold readings deepen below technical resistance
Technically, Microsoft is trading well below the major moving averages, signaling selling pressure in the short, medium, and long term, with the nearest dynamic resistance at the Ichimoku Kijun ($441.01) and no immediate support from averages. Momentum indicators remain deeply bearish — the MACD and ADX indicate a continuing selling trend, while the RSI (29.43), Stochastic RSI (15.52), CCI (–145.98), and Bull/Bear Power (–29.39) all highlight a strongly oversold state and clear seller dominance.
Sideways bias holds as downside risk outweighs breakout odds
Over the next five trading days, expect MSFT to move within a volatility band relative to current levels between $390.00 and $410.00. A sustained price increase is unlikely (under 20% probability), making further downside more probable. The baseline view is sideways trading within this range, while a bullish breakout would require clearing $441.00 resistance and a bearish move could see price slip below $390.00 to lower supports. Broader technical signals remain negative, so caution is warranted despite short-term oversold readings.
Previously it was reported that Microsoft Corporation is exhibiting pronounced bearish momentum across all major timeframes, remaining well below its key moving averages with technical indicators such as MACD, RSI, and oscillators signaling deep oversold conditions. Short-term downside risk persists, with the stock unlikely to reverse unless it decisively breaks above dynamic resistance near $441, while a drop below $385 could accelerate further losses.


Latest Microsoft News


-
 Afghanistan
-
 Albania
-
 Algeria
-
 Angola
-
 Argentina
-
 Armenia
-
 Australia
-
 Austria
-
 Azerbaijan
-
 Bahamas
-
 Bahrain
-
 Bangladesh
-
 Belarus
-
 Belgium
-
 Bolivia
-
 Botswana
-
 Brazil
-
 Brunei
-
 Bulgaria
-
 Cambodia
-
 Cameroon
-
 Canada
-
 Chile
Chile
-
 China
China
-
 Colombia
-
 Congo
Congo
-
 Costa Rica
-
 Cote d'Ivoire
-
 Croatia
-
 Cuba
Cuba
-
 Cyprus
-
 Czechia
-
 DR Congo
-
 Denmark
-
 Dominican Republic
-
 Ecuador
-
 Egypt
Egypt
-
 El Salvador
-
 Estonia
-
 Eswatini
-
 Ethiopia
-
 Finland
-
 France
-
 Georgia
-
 Germany
-
 Ghana
Ghana
-
 Greece
-
 Haiti
Haiti
-
 Hong Kong
-
 Hungary
-
 India
India
-
 Indonesia
-
 Iran, Islamic republic
-
 Iraq
Iraq
-
 Ireland
-
 Israel
-
 Italy
Italy
-
 Jamaica
-
 Japan
Japan
-
 Jordan
-
 Kazakhstan
-
 Kenya
Kenya
-
 Korea
Korea
-
 Kuwait
-
 Kyrgyzstan
-
 Laos
Laos
-
 Latvia
-
 Lebanon
-
 Lesotho
-
 Libya
Libya
-
 Lithuania
-
 Luxembourg
-
 Madagascar
-
 Malaysia
-
 Malta
Malta
-
 Mauritius
-
 Mexico
-
 Moldova
-
 Mongolia
-
 Montenegro
-
 Morocco
-
 Mozambique
-
 Myanmar
-
 Namibia
-
 Nepal
Nepal
-
 Netherlands
-
 New Zealand
-
 Nigeria
-
 North Macedonia
-
 Norway
-
 Oman
Oman
-
 Pakistan
-
 Palestine
-
 Panama
-
 Papua New Guinea
-
 Paraguay
-
 Peru
Peru
-
 Philippines
-
 Poland
-
 Portugal
-
 Puerto Rico
-
 Qatar
Qatar
-
 Reunion
-
 Romania
-
 Rwanda
-
 Saudi Arabia
-
 Serbia
-
 Singapore
-
 Slovakia
-
 Slovenia
-
 Somalia
-
 South Africa
-
 Spain
Spain
-
 Sri Lanka
-
 Sweden
-
 Switzerland
-
 Syria
Syria
-
 Taiwan
-
 Tajikistan
-
 Tanzania
-
 Thailand
-
 Trinidad and Tobago
-
 Tunisia
-
 Turkey
-
 UAE
UAE
-
 Uganda
-
 Ukraine
-
 United Kingdom
-
United States
-
 Uruguay
-
 Uzbekistan
-
 Venezuela
-
 Vietnam
-
 Yemen
Yemen
-
 Zambia
-
 Zimbabwe
- Forex
- Crypto
