
Microsoft stock: Key resistance and downtrend signals reinforce 4.97% slide

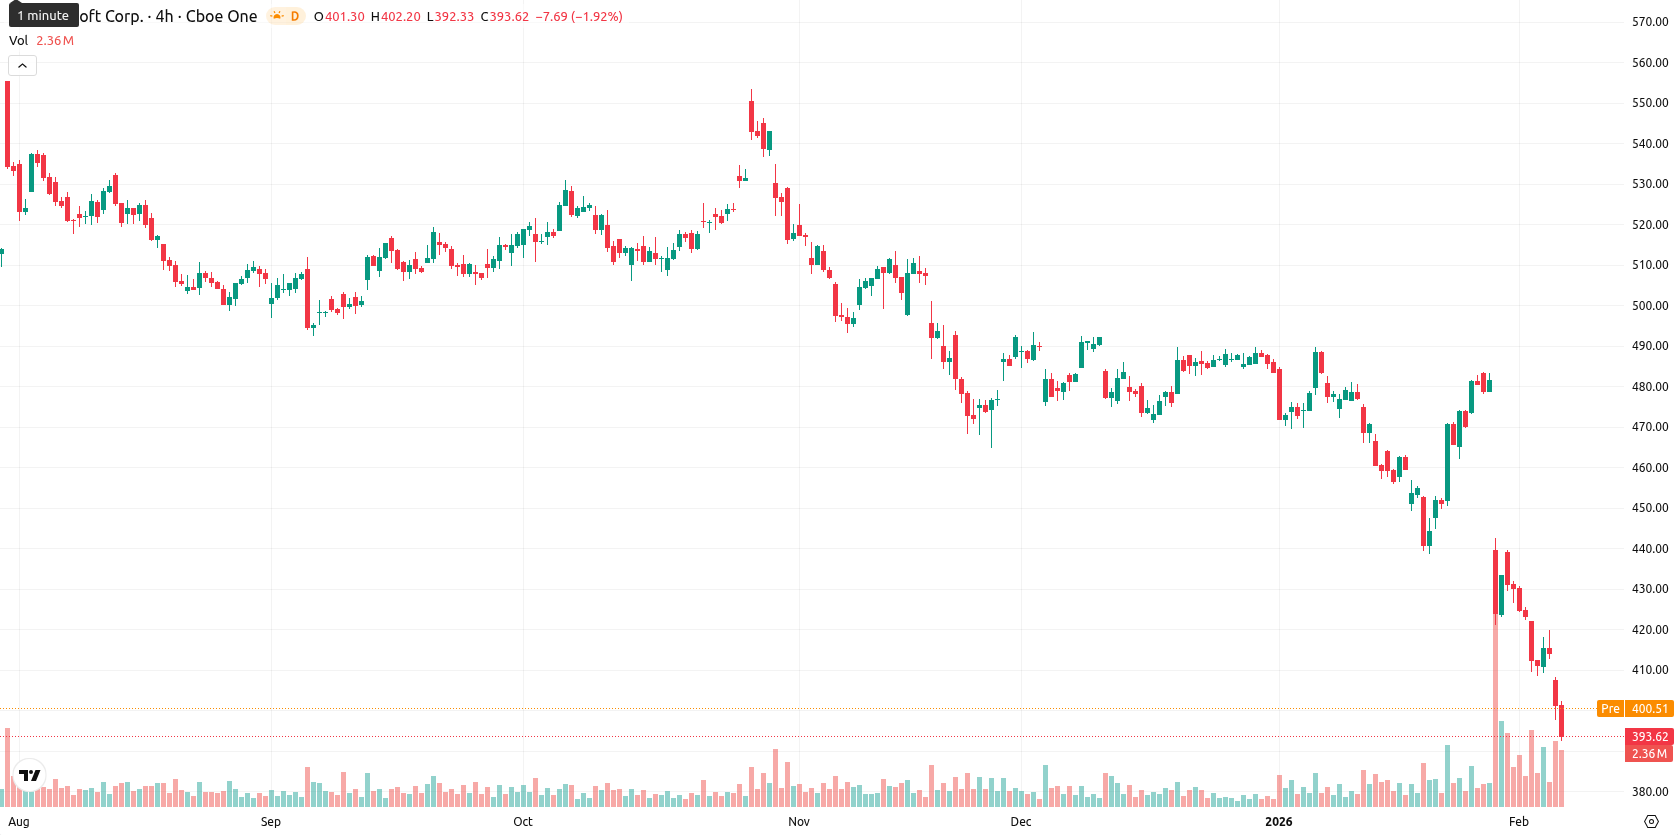
Microsoft Corporation (MSFT) is trading at $393.60, sitting well below the MA-20 at $451.78, MA-50 at $470.32, and MA-200 at $486.72, which confirms pronounced bearish pressure across all major timeframes. Intraday, the stock opened lower and has dropped 4.97% within today's volatile $392.33–$408.00 range, remaining near the session lows.
Highlights
- Microsoft reported fiscal Q2 revenue of $81.3 billion, up 17% year over year, and non-GAAP EPS of $4.14, both exceeding expectations.
- Conservative Azure growth guidance, driven by physical capacity constraints rather than demand weakness, weighed on sentiment despite continued AI investments and a strong financial position.
- Microsoft shares fell 4.97% to $393.60, trading below key moving averages, with strong bearish pressure and high probability of consolidation between $385.00 and $405.00 in the near term.
Azure guidance tempers strong earnings as capacity weighs on sentiment
Microsoft recently reported fiscal second-quarter earnings, posting $81.3 billion in revenue, up 17% year over year, and non-GAAP earnings per share of $4.14, both exceeding expectations. Despite these strong results, conservative growth guidance for its Azure cloud segment, attributed to physical capacity constraints rather than waning demand, has weighed on sentiment. The company continues to invest in AI integration across its product lineup and recently joined a UK government initiative focused on deepfake detection standards. Microsoft also maintains regular dividend payments and a strong financial position while monitoring regulatory and competitive risks in its core businesses.
Oversold readings deepen as major resistance halts recovery attempts
All major technical indicators point to bearish momentum. The price is well under the MA-20, MA-50, and MA-200, with the Ichimoku Kijun at $441.02 serving as the nearest dynamic resistance, and no significant moving average support found nearby. MACD and ADX confirm a persistent downtrend, while RSI, Stochastic RSI, and CCI register in deep oversold territory. Bull/Bear Power and the Awesome Oscillator further highlight strong seller dominance and reinforce the negative momentum backdrop.
Sustained downside risk as reversal depends on key resistance break
Short-term, MSFT is expected to remain under pressure, fluctuating within a typical volatility band of $385.00 to $405.00 over the next five trading days. There is a high probability (over 80%) of a continued decline, making a reversal unlikely unless the price decisively moves above the $441.00 Ichimoku Kijun resistance. Should the price fall below $385.00, short-term losses may accelerate further, in line with the strongly negative technical picture.
Last time, analysts noted that Microsoft was trading well below its key moving averages, confirming a strong and persistent downtrend as negative MACD and oversold oscillators, including an RSI below 30, signaled sustained bearish momentum. Technical resistance is observed near $449, while support is seen at recent lows, with limited breakout potential and continued consolidation expected within a narrow range given prevailing downside pressure.


Latest Microsoft News


-
 Afghanistan
-
 Albania
-
 Algeria
-
 Angola
-
 Argentina
-
 Armenia
-
 Australia
-
 Austria
-
 Azerbaijan
-
 Bahamas
-
 Bahrain
-
 Bangladesh
-
 Belarus
-
 Belgium
-
 Bolivia
-
 Botswana
-
 Brazil
-
 Brunei
-
 Bulgaria
-
 Cambodia
-
 Cameroon
-
 Canada
-
 Chile
Chile
-
 China
China
-
 Colombia
-
 Congo
Congo
-
 Costa Rica
-
 Cote d'Ivoire
-
 Croatia
-
 Cuba
Cuba
-
 Cyprus
-
 Czechia
-
 DR Congo
-
 Denmark
-
 Dominican Republic
-
 Ecuador
-
 Egypt
Egypt
-
 El Salvador
-
 Estonia
-
 Eswatini
-
 Ethiopia
-
 Finland
-
 France
-
 Georgia
-
 Germany
-
 Ghana
Ghana
-
 Greece
-
 Haiti
Haiti
-
 Hong Kong
-
 Hungary
-
 India
India
-
 Indonesia
-
 Iran, Islamic republic
-
 Iraq
Iraq
-
 Ireland
-
 Israel
-
 Italy
Italy
-
 Jamaica
-
 Japan
Japan
-
 Jordan
-
 Kazakhstan
-
 Kenya
Kenya
-
 Korea
Korea
-
 Kuwait
-
 Kyrgyzstan
-
 Laos
Laos
-
 Latvia
-
 Lebanon
-
 Lesotho
-
 Libya
Libya
-
 Lithuania
-
 Luxembourg
-
 Madagascar
-
 Malaysia
-
 Malta
Malta
-
 Mauritius
-
 Mexico
-
 Moldova
-
 Mongolia
-
 Montenegro
-
 Morocco
-
 Mozambique
-
 Myanmar
-
 Namibia
-
 Nepal
Nepal
-
 Netherlands
-
 New Zealand
-
 Nigeria
-
 North Macedonia
-
 Norway
-
 Oman
Oman
-
 Pakistan
-
 Palestine
-
 Panama
-
 Papua New Guinea
-
 Paraguay
-
 Peru
Peru
-
 Philippines
-
 Poland
-
 Portugal
-
 Puerto Rico
-
 Qatar
Qatar
-
 Reunion
-
 Romania
-
 Rwanda
-
 Saudi Arabia
-
 Serbia
-
 Singapore
-
 Slovakia
-
 Slovenia
-
 Somalia
-
 South Africa
-
 Spain
Spain
-
 Sri Lanka
-
 Sweden
-
 Switzerland
-
 Syria
Syria
-
 Taiwan
-
 Tajikistan
-
 Tanzania
-
 Thailand
-
 Trinidad and Tobago
-
 Tunisia
-
 Turkey
-
 UAE
UAE
-
 Uganda
-
 Ukraine
-
 United Kingdom
-
United States
-
 Uruguay
-
 Uzbekistan
-
 Venezuela
-
 Vietnam
-
 Yemen
Yemen
-
 Zambia
-
 Zimbabwe
- Forex
- Crypto
