
Less than 1% for Microsoft stock — bearish momentum dominates despite solid results

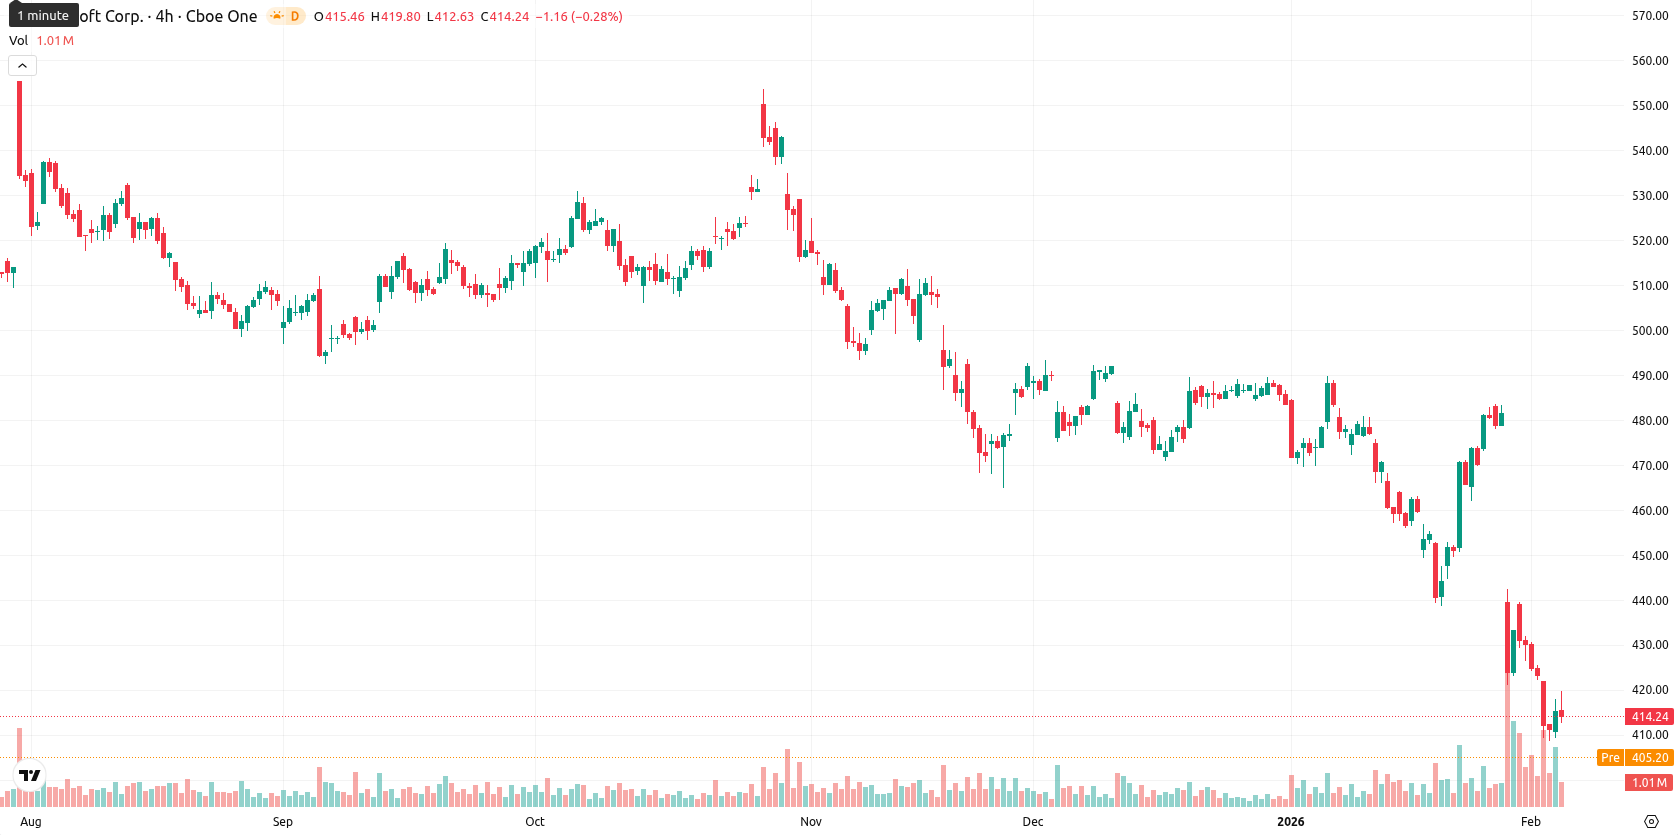
Microsoft Corporation (MSFT) is trading at $414.42, showing a daily gain of $3.21 or 0.78%. The price remains well below short, medium, and long-term moving averages, confirming a persistent downtrend.
Highlights
- Microsoft reported robust fiscal Q2 2026 earnings with $81.27 billion revenue and $38.46 billion net income, driven by record cloud performance and new AI chip launch.
- Investors shifted focus to moderating Azure growth and elevated AI capital expenditures, which reached $37.5 billion for the quarter.
- Technical analysis shows persistent bearish momentum with Microsoft trading at $414.42, well below MA-20 ($456.27), and resistance at $449.13, signaling likely sideways or downward price action.
Investor caution rises as Azure growth slows amid heavy AI spending
Microsoft reported strong fiscal Q2 2026 results with revenue of $81.27 billion and net income of $38.46 billion. Despite record cloud performance and the launch of its Maia 200 AI inference chip, investor focus shifted to moderating Azure growth and increased AI capital expenditures of $37.5 billion. The company continued returning capital to shareholders with a quarterly dividend of $0.91 per share and made leadership changes to drive AI and cybersecurity initiatives.
Bearish pressure intensifies as price breaks support and indicators flag oversold
Microsoft’s price is far below the MA-20 ($456.27), MA-50 ($471.88), and MA-200 ($486.55), confirming a strong downward trend across all observed timeframes. There is major technical resistance at the Ichimoku Kijun level of $449.13, with support found near recent lows as defined by recent price action. Momentum indicators such as a negative MACD and a strong “Sell” from ADX suggest persistent bearish pressure. Several oscillators, including RSI at 29.42, Stochastic RSI, and CCI, show oversold conditions, while Bull/Bear Power remains firmly negative and the Awesome Oscillator signals downside pressure.
Downside risk prevails as breakout odds remain limited by bearish momentum
In the short term, Microsoft is expected to remain within a typical volatility band of $410.00 to $420.00, according to recent price action. The probability of a sustained breakout above resistance is very low, with trend signals favoring either further declines or sideways movement. The main scenario points toward continued consolidation within a tight corridor, where oversold signals may lead to brief bounces but overall bearish momentum is likely to restrict upward movement. Brief recoveries could target $420.00, while renewed selling may open the path toward $410.00 and below if pressure intensifies.
Previously it was reported that Microsoft shares extended their bearish trend, closing well below all major weekly moving averages with technical indicators such as RSI, Stochastic RSI, and CCI highlighting intensifying oversold and downside momentum. The stock remains under persistent selling pressure, shows no immediate dynamic support above current levels, and faces resistance at the Ichimoku Kijun line, with near-term stabilization expected in a narrow range unless $449 is reclaimed.


Latest Microsoft News


-
 Afghanistan
-
 Albania
-
 Algeria
-
 Angola
-
 Argentina
-
 Armenia
-
 Australia
-
 Austria
-
 Azerbaijan
-
 Bahamas
-
 Bahrain
-
 Bangladesh
-
 Belarus
-
 Belgium
-
 Bolivia
-
 Botswana
-
 Brazil
-
 Brunei
-
 Bulgaria
-
 Cambodia
-
 Cameroon
-
 Canada
-
 Chile
Chile
-
 China
China
-
 Colombia
-
 Congo
Congo
-
 Costa Rica
-
 Cote d'Ivoire
-
 Croatia
-
 Cuba
Cuba
-
 Cyprus
-
 Czechia
-
 DR Congo
-
 Denmark
-
 Dominican Republic
-
 Ecuador
-
 Egypt
Egypt
-
 El Salvador
-
 Estonia
-
 Eswatini
-
 Ethiopia
-
 Finland
-
 France
-
 Georgia
-
 Germany
-
 Ghana
Ghana
-
 Greece
-
 Haiti
Haiti
-
 Hong Kong
-
 Hungary
-
 India
India
-
 Indonesia
-
 Iran, Islamic republic
-
 Iraq
Iraq
-
 Ireland
-
 Israel
-
 Italy
Italy
-
 Jamaica
-
 Japan
Japan
-
 Jordan
-
 Kazakhstan
-
 Kenya
Kenya
-
 Korea
Korea
-
 Kuwait
-
 Kyrgyzstan
-
 Laos
Laos
-
 Latvia
-
 Lebanon
-
 Lesotho
-
 Libya
Libya
-
 Lithuania
-
 Luxembourg
-
 Madagascar
-
 Malaysia
-
 Malta
Malta
-
 Mauritius
-
 Mexico
-
 Moldova
-
 Mongolia
-
 Montenegro
-
 Morocco
-
 Mozambique
-
 Myanmar
-
 Namibia
-
 Nepal
Nepal
-
 Netherlands
-
 New Zealand
-
 Nigeria
-
 North Macedonia
-
 Norway
-
 Oman
Oman
-
 Pakistan
-
 Palestine
-
 Panama
-
 Papua New Guinea
-
 Paraguay
-
 Peru
Peru
-
 Philippines
-
 Poland
-
 Portugal
-
 Puerto Rico
-
 Qatar
Qatar
-
 Reunion
-
 Romania
-
 Rwanda
-
 Saudi Arabia
-
 Serbia
-
 Singapore
-
 Slovakia
-
 Slovenia
-
 Somalia
-
 South Africa
-
 Spain
Spain
-
 Sri Lanka
-
 Sweden
-
 Switzerland
-
 Syria
Syria
-
 Taiwan
-
 Tajikistan
-
 Tanzania
-
 Thailand
-
 Trinidad and Tobago
-
 Tunisia
-
 Turkey
-
 UAE
UAE
-
 Uganda
-
 Ukraine
-
 United Kingdom
-
United States
-
 Uruguay
-
 Uzbekistan
-
 Venezuela
-
 Vietnam
-
 Yemen
Yemen
-
 Zambia
-
 Zimbabwe
- Forex
- Crypto
