
Microsoft weekly outlook: slips 4.39% as sellers dominate and key supports break

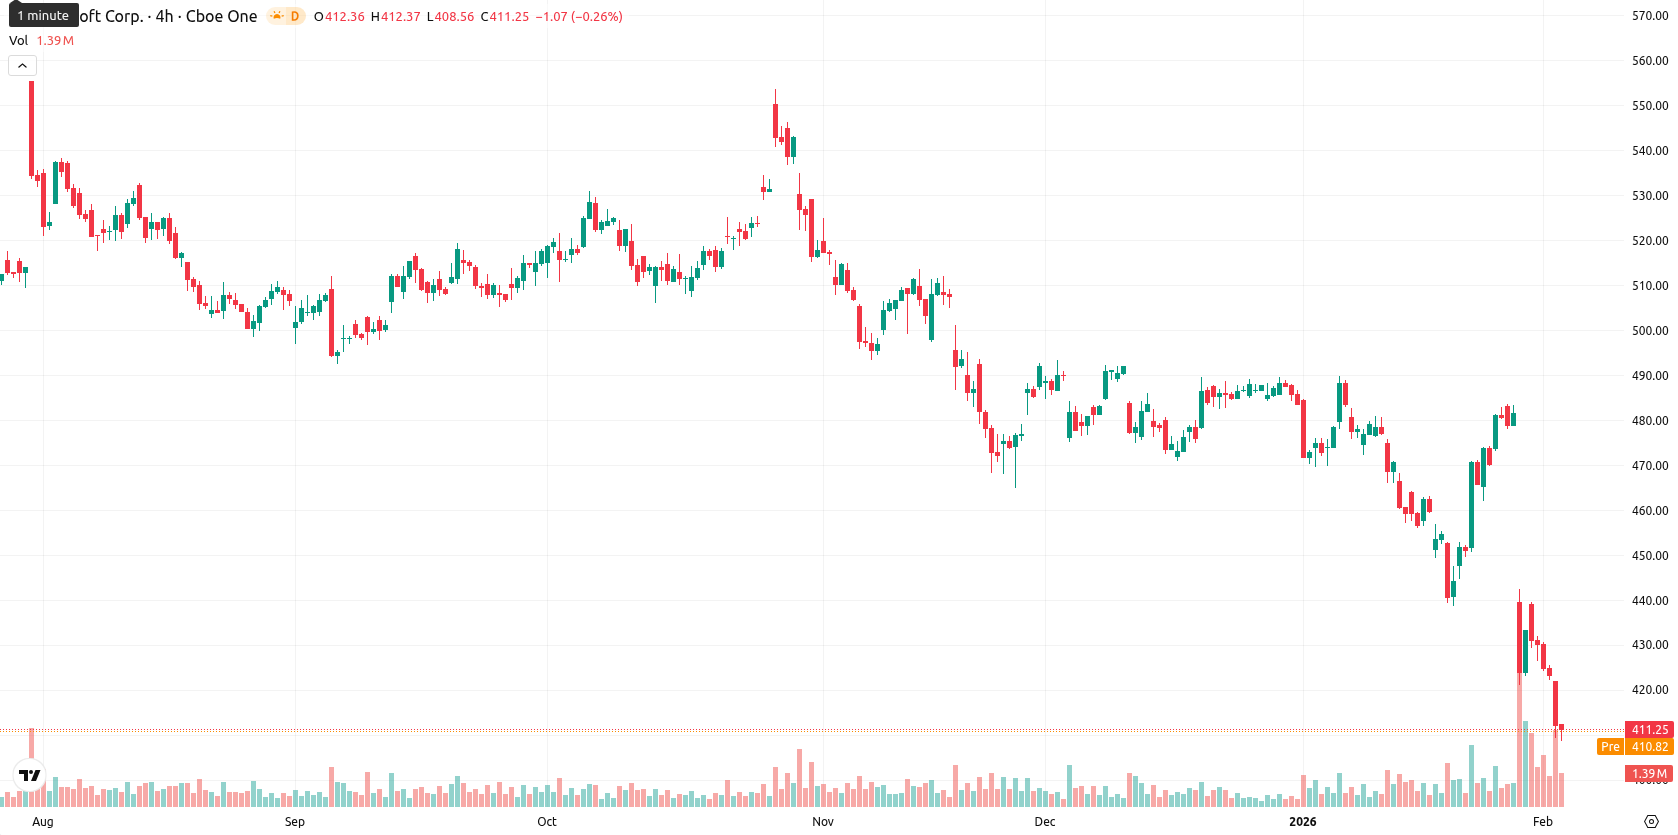
Microsoft Corporation (MSFT) shares traded with pronounced weakness over the past week, falling sharply and closing significantly below the weekly MA-20 at $459.49, MA-50 at $473.17, and MA-200 at $486.32. This weekly performance places the stock in a clear downtrend, with ongoing downside pressure and no immediate support above current price levels according to weekly moving averages.
Highlights
- Microsoft shares trade significantly below key moving averages—MA-20 at $459.49, MA-50 at $473.17, MA-200 at $486.32—reflecting sustained multi-timeframe selling pressure.
- Daily momentum indicators including MACD, ADX, RSI, Stochastic RSI, and CCI confirm a strong ‘Sell’ bias and deeply oversold market conditions.
- For the next five trading days, Microsoft is expected to consolidate tightly between $410 and $415, with upside probability below 20% and key resistance at $449.18.
Strong earnings offset by margin concerns and AI spending this week
Microsoft reported fiscal 2026 second-quarter results with revenue of $81.27 billion and adjusted earnings per share of $4.14, both exceeding forecasts. Despite the strong revenue, investors remain focused on rising capital expenditures for artificial intelligence infrastructure and continued uncertainty over profit margins. The company announced a quarterly dividend of $0.91 per share, with the next payment scheduled for March 12, while also investing further in AI capabilities and new processors.
Entrenched bearish momentum as oversold signals intensify over week
On the weekly chart, Microsoft remains below all major moving averages, with the nearest resistance at the Ichimoku Kijun line around $449.18. There is no identifiable dynamic support above current price zones on the weekly timeframe. Weekly indicators suggest intensified seller dominance, with RSI, Stochastic RSI, and CCI all signaling oversold conditions, while the Awesome Oscillator and Bear Power confirm the entrenched bearish momentum.
Limited rebound odds as weekly range likely to hold in coming days
For the next five to seven trading days, Microsoft is likely to consolidate in a narrow range between $410 and $415, as technical factors point to continued sideways or downward movement. The probability of a significant rebound remains low unless the price can reclaim the $449 resistance zone. Should support at $410 fail, additional losses are possible, but base-case expectations favor stabilization within the current band.
Previously it was reported that Microsoft is trading well below all major moving averages, with technical indicators such as the MACD and RSI showing sustained downside momentum and multiple oversold signals. The prevailing trend remains bearish with no immediate dynamic support, resistance at the Ichimoku Kijun, and a high likelihood of continued volatility and further price declines in the near term.


Latest Microsoft News


-
 Afghanistan
-
 Albania
-
 Algeria
-
 Angola
-
 Argentina
-
 Armenia
-
 Australia
-
 Austria
-
 Azerbaijan
-
 Bahamas
-
 Bahrain
-
 Bangladesh
-
 Belarus
-
 Belgium
-
 Bolivia
-
 Botswana
-
 Brazil
-
 Brunei
-
 Bulgaria
-
 Cambodia
-
 Cameroon
-
 Canada
-
 Chile
Chile
-
 China
China
-
 Colombia
-
 Congo
Congo
-
 Costa Rica
-
 Cote d'Ivoire
-
 Croatia
-
 Cuba
Cuba
-
 Cyprus
-
 Czechia
-
 DR Congo
-
 Denmark
-
 Dominican Republic
-
 Ecuador
-
 Egypt
Egypt
-
 El Salvador
-
 Estonia
-
 Eswatini
-
 Ethiopia
-
 Finland
-
 France
-
 Georgia
-
 Germany
-
 Ghana
Ghana
-
 Greece
-
 Haiti
Haiti
-
 Hong Kong
-
 Hungary
-
 India
India
-
 Indonesia
-
 Iran, Islamic republic
-
 Iraq
Iraq
-
 Ireland
-
 Israel
-
 Italy
Italy
-
 Jamaica
-
 Japan
Japan
-
 Jordan
-
 Kazakhstan
-
 Kenya
Kenya
-
 Korea
Korea
-
 Kuwait
-
 Kyrgyzstan
-
 Laos
Laos
-
 Latvia
-
 Lebanon
-
 Lesotho
-
 Libya
Libya
-
 Lithuania
-
 Luxembourg
-
 Madagascar
-
 Malaysia
-
 Malta
Malta
-
 Mauritius
-
 Mexico
-
 Moldova
-
 Mongolia
-
 Montenegro
-
 Morocco
-
 Mozambique
-
 Myanmar
-
 Namibia
-
 Nepal
Nepal
-
 Netherlands
-
 New Zealand
-
 Nigeria
-
 North Macedonia
-
 Norway
-
 Oman
Oman
-
 Pakistan
-
 Palestine
-
 Panama
-
 Papua New Guinea
-
 Paraguay
-
 Peru
Peru
-
 Philippines
-
 Poland
-
 Portugal
-
 Puerto Rico
-
 Qatar
Qatar
-
 Reunion
-
 Romania
-
 Rwanda
-
 Saudi Arabia
-
 Serbia
-
 Singapore
-
 Slovakia
-
 Slovenia
-
 Somalia
-
 South Africa
-
 Spain
Spain
-
 Sri Lanka
-
 Sweden
-
 Switzerland
-
 Syria
Syria
-
 Taiwan
-
 Tajikistan
-
 Tanzania
-
 Thailand
-
 Trinidad and Tobago
-
 Tunisia
-
 Turkey
-
 UAE
UAE
-
 Uganda
-
 Ukraine
-
 United Kingdom
-
United States
-
 Uruguay
-
 Uzbekistan
-
 Venezuela
-
 Vietnam
-
 Yemen
Yemen
-
 Zambia
-
 Zimbabwe
- Forex
- Crypto
