
Microsoft stock price forecast: Downtrend persists as MSFT slides below key support

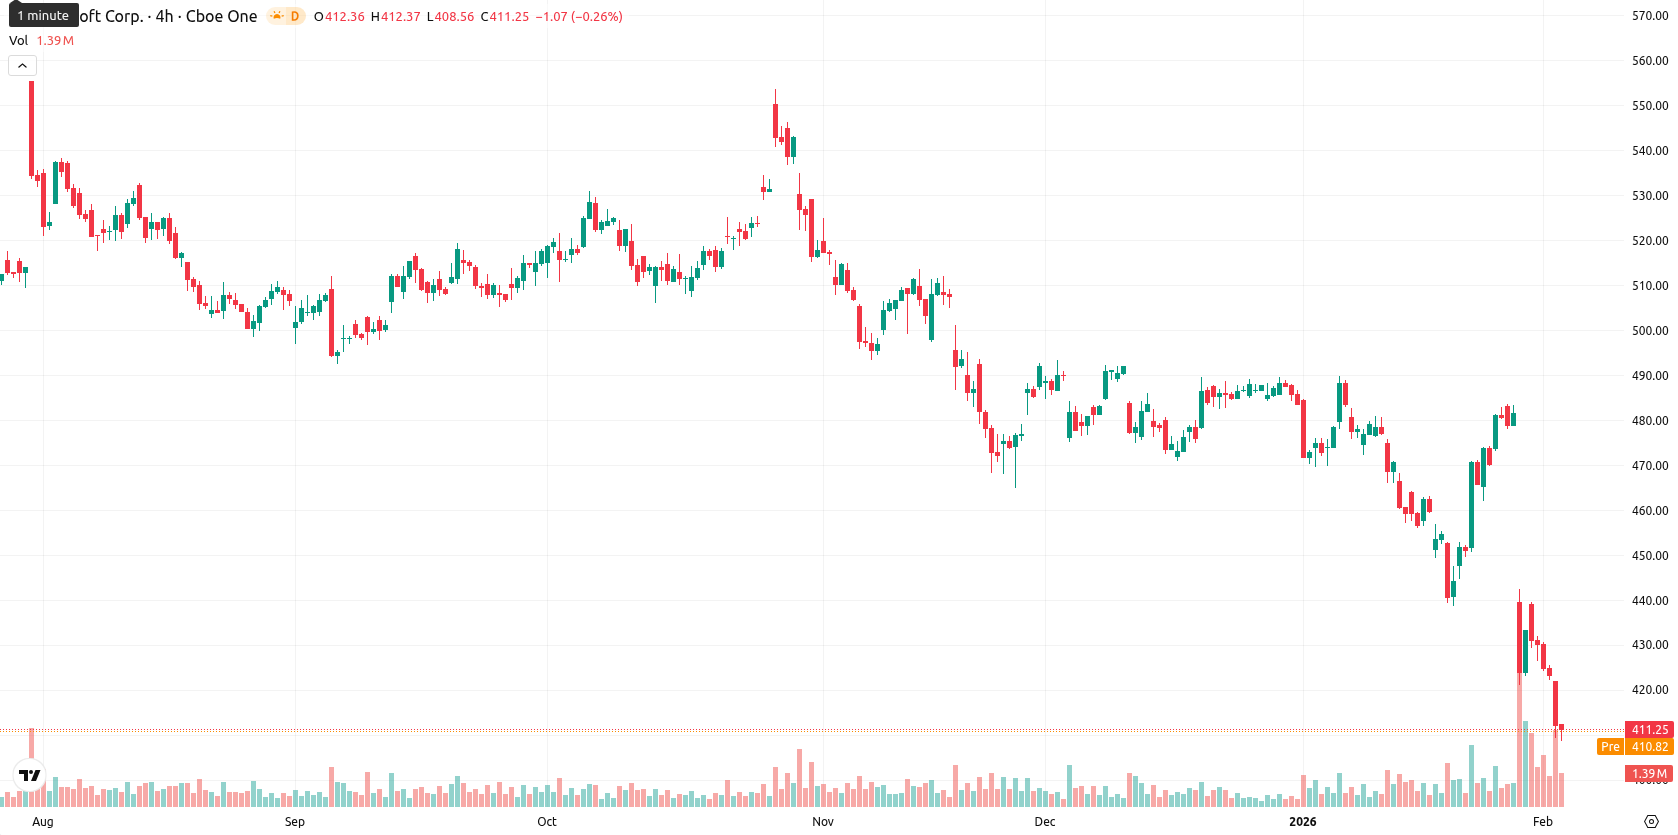
Microsoft Corporation (MSFT) is trading well below the MA-20 ($459.49), MA-50 ($473.17), and MA-200 ($486.32), confirming sustained short-, medium-, and long-term bearish pressure. The nearest dynamic resistance is the Ichimoku Kijun at $449.18, while no immediate dynamic support is present below the current price.
Highlights
- Microsoft posted fiscal Q2 2026 revenue of $81.3 billion (up 17% YoY) and adjusted EPS of $4.14, both beating analyst expectations.
- Despite strong growth, expanding AI and cloud infrastructure investments pressured margins and raised concerns about short-term capital efficiency.
- Microsoft trades near $408.66–$419.01, well below MA-20/50/200, with sustained bearish momentum and high volatility as sellers dominate short-term action.
Margin pressures emerge despite revenue growth and AI investment gains
Microsoft reported fiscal Q2 2026 results showing revenue of $81.3 billion, up 17% year-over-year, and adjusted earnings per share of $4.14, both exceeding analyst expectations. Despite the strong figures, the company highlighted rising investments in artificial intelligence and cloud infrastructure that have pressured margins and raised concerns about short-term capital efficiency. Growth in Remaining Performance Obligations reached $625 billion, with continued shareholder returns via dividends and share repurchases. The recent launch of the second-generation Maia 200 AI chip in January 2026 further demonstrates Microsoft's push to strengthen its cloud services.
Oversold signals and dominant selling as gap down heightens volatility
Momentum remains negative, with the MACD signaling a persistent downtrend and the ADX indicating a developing but not extreme trend. Multiple oversold signals appear across the RSI, Stochastic RSI, and CCI, highlighting short-term exhaustion, while Bull/Bear Power confirms sellers dominate; the Awesome Oscillator also supports the prevailing bearish tone. The current price has dropped 2.86% today, opening significantly lower than yesterday’s close, registering a gap down; it now sits near the bottom of today’s range ($408.66–$419.01) as volatility remains high and selling pressure has intensified after the open.
Sideways trading base as bearish odds outweigh bullish reversal
For the next five trading days, the expected price range is normalized to $400–$420. Based on weekly indicator signals, there is a very low probability (less than 20%) of a price increase, while the likelihood of further decline is much higher. The baseline scenario is for Microsoft to move sideways between $400 and $420 as bears and exhausted sellers compete. A bullish scenario would require a strong move above $420, challenging resistance near the Ichimoku Kijun; a bearish scenario sees further breakdown below $400, opening room for accelerated declines.
Last time, analysts noted that Microsoft Corporation was trading under persistent bearish pressure below all major moving averages, with technical indicators such as RSI, MACD, and ADX confirming highly oversold conditions and sustained downside momentum. Support was identified just above $417.50 and resistance near the Ichimoku Kijun level of $455.36, with consolidation expected in a lower trading band amid elevated short-term volatility and a low likelihood of a near-term rebound.


Latest Microsoft News


-
 Afghanistan
-
 Albania
-
 Algeria
-
 Angola
-
 Argentina
-
 Armenia
-
 Australia
-
 Austria
-
 Azerbaijan
-
 Bahamas
-
 Bahrain
-
 Bangladesh
-
 Belarus
-
 Belgium
-
 Bolivia
-
 Botswana
-
 Brazil
-
 Brunei
-
 Bulgaria
-
 Cambodia
-
 Cameroon
-
 Canada
-
 Chile
Chile
-
 China
China
-
 Colombia
-
 Congo
Congo
-
 Costa Rica
-
 Cote d'Ivoire
-
 Croatia
-
 Cuba
Cuba
-
 Cyprus
-
 Czechia
-
 DR Congo
-
 Denmark
-
 Dominican Republic
-
 Ecuador
-
 Egypt
Egypt
-
 El Salvador
-
 Estonia
-
 Eswatini
-
 Ethiopia
-
 Finland
-
 France
-
 Georgia
-
 Germany
-
 Ghana
Ghana
-
 Greece
-
 Haiti
Haiti
-
 Hong Kong
-
 Hungary
-
 India
India
-
 Indonesia
-
 Iran, Islamic republic
-
 Iraq
Iraq
-
 Ireland
-
 Israel
-
 Italy
Italy
-
 Jamaica
-
 Japan
Japan
-
 Jordan
-
 Kazakhstan
-
 Kenya
Kenya
-
 Korea
Korea
-
 Kuwait
-
 Kyrgyzstan
-
 Laos
Laos
-
 Latvia
-
 Lebanon
-
 Lesotho
-
 Libya
Libya
-
 Lithuania
-
 Luxembourg
-
 Madagascar
-
 Malaysia
-
 Malta
Malta
-
 Mauritius
-
 Mexico
-
 Moldova
-
 Mongolia
-
 Montenegro
-
 Morocco
-
 Mozambique
-
 Myanmar
-
 Namibia
-
 Nepal
Nepal
-
 Netherlands
-
 New Zealand
-
 Nigeria
-
 North Macedonia
-
 Norway
-
 Oman
Oman
-
 Pakistan
-
 Palestine
-
 Panama
-
 Papua New Guinea
-
 Paraguay
-
 Peru
Peru
-
 Philippines
-
 Poland
-
 Portugal
-
 Puerto Rico
-
 Qatar
Qatar
-
 Reunion
-
 Romania
-
 Rwanda
-
 Saudi Arabia
-
 Serbia
-
 Singapore
-
 Slovakia
-
 Slovenia
-
 Somalia
-
 South Africa
-
 Spain
Spain
-
 Sri Lanka
-
 Sweden
-
 Switzerland
-
 Syria
Syria
-
 Taiwan
-
 Tajikistan
-
 Tanzania
-
 Thailand
-
 Trinidad and Tobago
-
 Tunisia
-
 Turkey
-
 UAE
UAE
-
 Uganda
-
 Ukraine
-
 United Kingdom
-
United States
-
 Uruguay
-
 Uzbekistan
-
 Venezuela
-
 Vietnam
-
 Yemen
Yemen
-
 Zambia
-
 Zimbabwe
- Forex
- Crypto
