
Core Scientific stock rises 5.06% as bullish momentum persists despite neutral indicators

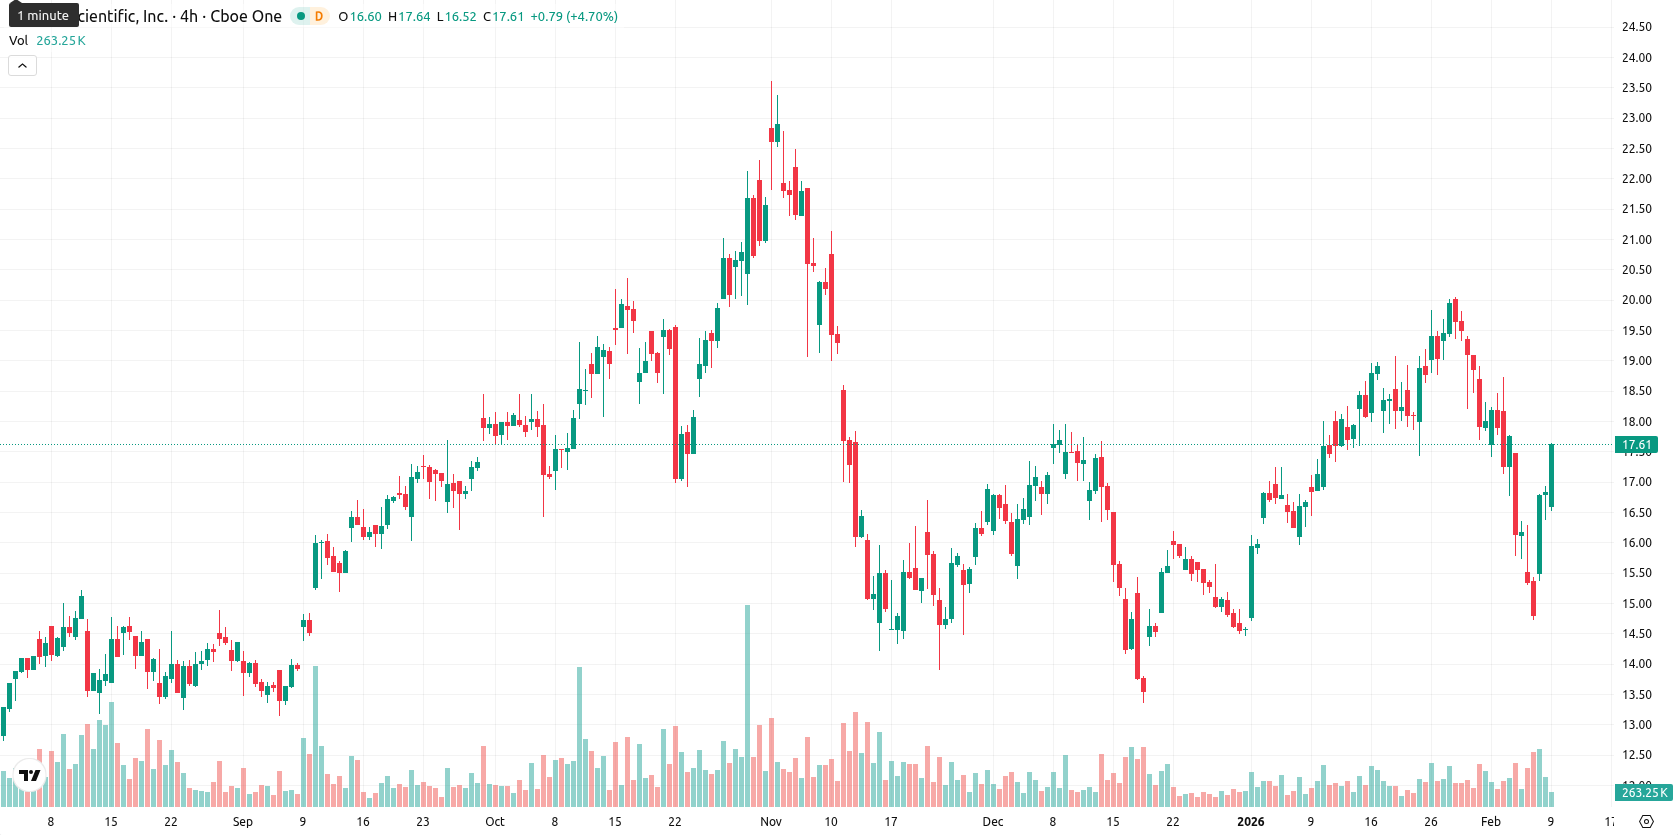
Core Scientific, Inc. (CORZ) is trading at $17.66 after gaining $0.85 or 5.06% on the day. The price is slightly below the MA-20 at $17.98, sits above the MA-50 at $16.81, and is well above the MA-200 at $15.05, reflecting short-term downward pressure but an overall bullish medium- and long-term structure.
Highlights
- Core Scientific ($17.66) trades slightly below its MA-20 ($17.98) but remains above both the MA-50 ($16.81) and MA-200 ($15.05), indicating a bullish medium- and long-term structure despite short-term seller pressure.
- Technical momentum signals are mixed, with the Awesome Oscillator and CCI indicating oversold and sell conditions, while the Stochastic RSI suggests a strong buy, reflecting current market indecision.
- For the next five trading days, price is likely to consolidate between $17.73 and $18.42, with more than 80% probability of an increase and key support at the Kijun ($17.26); a break above $18.40 would signal renewed bullish momentum.
Oscillator divergence intensifies as support and resistance define range
The technical landscape shows the Ichimoku Kijun at $17.26 providing dynamic support, while the MA-20 at $17.98 acts as short-term resistance. Key momentum indicators are mixed—Daily MACD and ADX are neutral, RSI hovers just below 50 and favors a sell bias, and Stochastic RSI points to a strong buy. The Commodity Channel Index and Bull/Bear Power both indicate oversold conditions with seller dominance, and the Awesome Oscillator still gives a strong sell signal. Despite moderate but rising volatility and today’s price gain near the top of its daily range, the conflicting signals from oscillators and momentum indicators underscore ongoing divergence.
Upside scenario likely as bullish momentum offsets pullback risk
Over the next five trading days, the typical volatility band is projected between $17.73 and $18.42. Bullish momentum, evidenced by strong weekly readings in Moving Average, RSI, and MACD, points to a high probability (above 80%) of further upside. The baseline scenario is consolidation between $17.70 and $18.40, but a sustained move above short-term resistance at $18.40 could add to gains. A bearish reversal below $17.26 (Kijun support) would increase the risk of a pullback toward the $16.80 area.
Previously it was reported that Core Scientific Inc. is trading just above its medium-term moving averages, with the price action reflecting ongoing short-term selling pressure and support from longer-term trends. Momentum indicators are mixed, with oversold signals constraining upside potential, suggesting the stock may consolidate sideways unless a decisive breakout occurs.


Latest Core Scientific News


-
 Afghanistan
-
 Albania
-
 Algeria
-
 Angola
-
 Argentina
-
 Armenia
-
 Australia
-
 Austria
-
 Azerbaijan
-
 Bahamas
-
 Bahrain
-
 Bangladesh
-
 Belarus
-
 Belgium
-
 Bolivia
-
 Botswana
-
 Brazil
-
 Brunei
-
 Bulgaria
-
 Cambodia
-
 Cameroon
-
 Canada
-
 Chile
Chile
-
 China
China
-
 Colombia
-
 Congo
Congo
-
 Costa Rica
-
 Cote d'Ivoire
-
 Croatia
-
 Cuba
Cuba
-
 Cyprus
-
 Czechia
-
 DR Congo
-
 Denmark
-
 Dominican Republic
-
 Ecuador
-
 Egypt
Egypt
-
 El Salvador
-
 Estonia
-
 Eswatini
-
 Ethiopia
-
 Finland
-
 France
-
 Georgia
-
 Germany
-
 Ghana
Ghana
-
 Greece
-
 Haiti
Haiti
-
 Hong Kong
-
 Hungary
-
 India
India
-
 Indonesia
-
 Iran, Islamic republic
-
 Iraq
Iraq
-
 Ireland
-
 Israel
-
 Italy
Italy
-
 Jamaica
-
 Japan
Japan
-
 Jordan
-
 Kazakhstan
-
 Kenya
Kenya
-
 Korea
Korea
-
 Kuwait
-
 Kyrgyzstan
-
 Laos
Laos
-
 Latvia
-
 Lebanon
-
 Lesotho
-
 Libya
Libya
-
 Lithuania
-
 Luxembourg
-
 Madagascar
-
 Malaysia
-
 Malta
Malta
-
 Mauritius
-
 Mexico
-
 Moldova
-
 Mongolia
-
 Montenegro
-
 Morocco
-
 Mozambique
-
 Myanmar
-
 Namibia
-
 Nepal
Nepal
-
 Netherlands
-
 New Zealand
-
 Nigeria
-
 North Macedonia
-
 Norway
-
 Oman
Oman
-
 Pakistan
-
 Palestine
-
 Panama
-
 Papua New Guinea
-
 Paraguay
-
 Peru
Peru
-
 Philippines
-
 Poland
-
 Portugal
-
 Puerto Rico
-
 Qatar
Qatar
-
 Reunion
-
 Romania
-
 Rwanda
-
 Saudi Arabia
-
 Serbia
-
 Singapore
-
 Slovakia
-
 Slovenia
-
 Somalia
-
 South Africa
-
 Spain
Spain
-
 Sri Lanka
-
 Sweden
-
 Switzerland
-
 Syria
Syria
-
 Taiwan
-
 Tajikistan
-
 Tanzania
-
 Thailand
-
 Trinidad and Tobago
-
 Tunisia
-
 Turkey
-
 UAE
UAE
-
 Uganda
-
 Ukraine
-
 United Kingdom
-
United States
-
 Uruguay
-
 Uzbekistan
-
 Venezuela
-
 Vietnam
-
 Yemen
Yemen
-
 Zambia
-
 Zimbabwe
- Forex
- Crypto
