
JetBlue stock: Bullish weekly signals meet near-term pullback for a mixed result

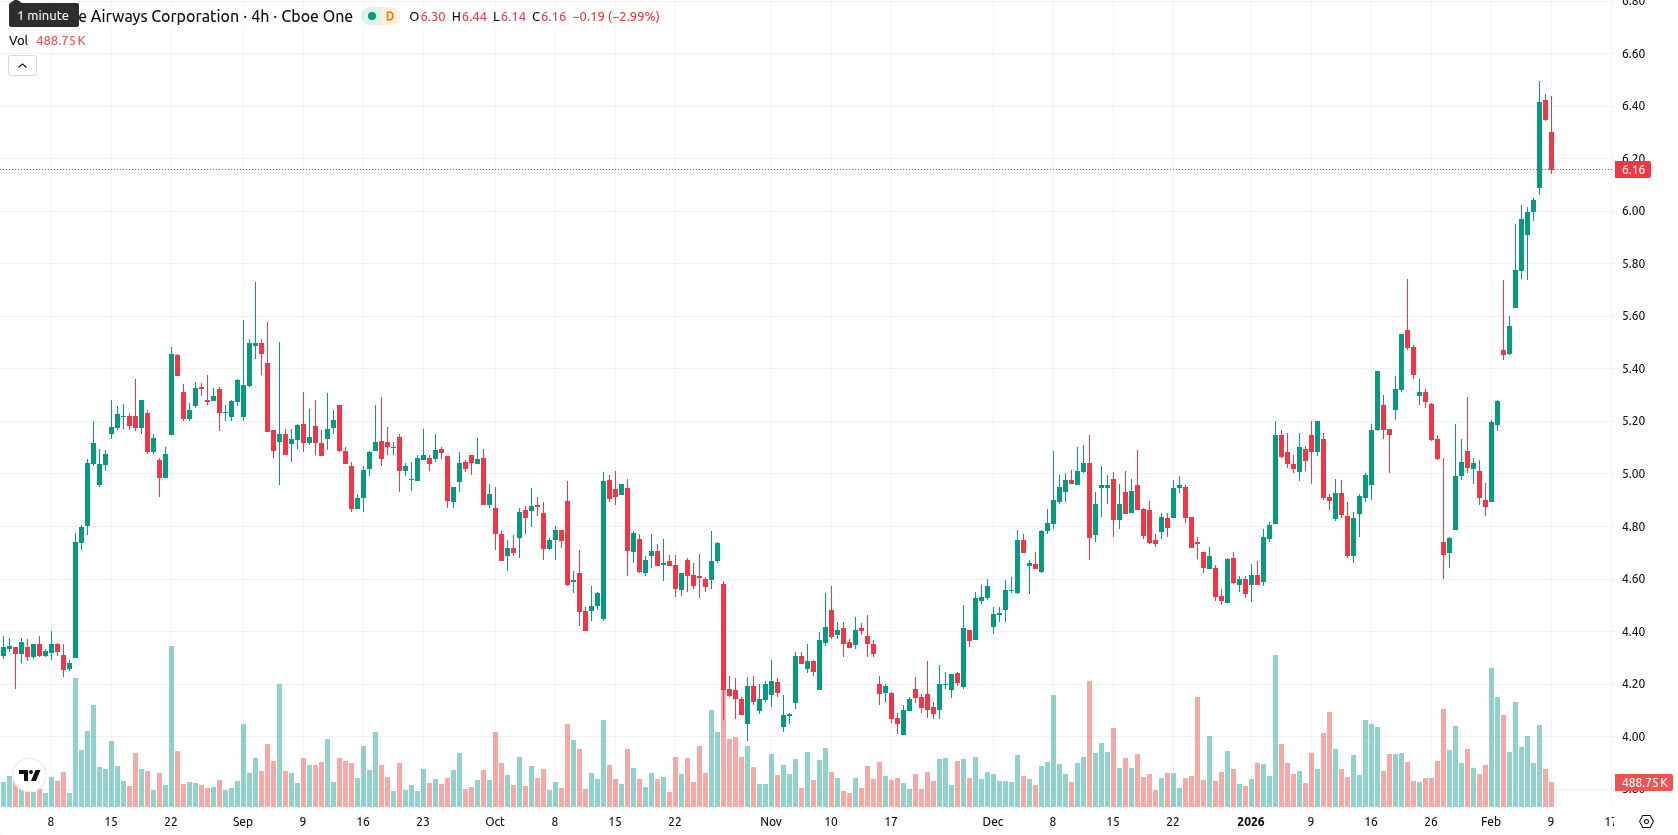
JetBlue Airways Corp (JBLU) is currently trading well above key Moving Averages, with the price above the MA-20 ($5.27), MA-50 ($4.97), and MA-200 ($4.74), confirming a strong bullish structure across all timeframes. The nearest dynamic support is the Ichimoku Kijun at $5.50, while resistance is now near the MA-50, with the next psychological level around $6.50.
Highlights
- JetBlue experienced widespread operational disruptions with cancellations and delays at Boston Logan, JFK, and Orlando International Airports, impacting service reliability.
- JetBlue launched a new aircraft livery celebrating Dominican Republic culture to reinforce its tourism initiatives and expanded focus on the Caribbean market.
- JetBlue ($6.15) trades above its MA-20, MA-50, and MA-200, with support at $5.50 and a high-probability consolidation range of $6.10–$6.45 over the next week.
Operational disruptions and legal scrutiny as JetBlue expands Caribbean focus
JetBlue recently faced operational disruptions across major U.S. airports, including multiple cancellations and delays at Boston Logan, John F. Kennedy, and Orlando International Airports. The airline also introduced a new aircraft livery highlighting Dominican Republic culture to support tourism and its Caribbean market presence. Additionally, passengers filed lawsuits against Airbus after an October 2025 software issue on an A320 triggered a legal and safety review.
Bullish momentum diverges with overbought signals and intraday volatility
Momentum indicators show generally positive signals: the daily MACD is bullish, and ADX is neutral, suggesting trend strength is not yet well established. However, several oscillators — RSI (70.98), Stochastic RSI (100.00), and CCI (223.25) — signal overbought conditions, and Bull/Bear Power (0.98) indicates buyers remain dominant intraday. The Awesome Oscillator supports the bullish view, but negative daily performance (down 3.38% to $6.15) suggests pullback pressure. There was no open gap (open: $6.31 vs. previous close: $6.36), and the current price is near today’s low ($6.16 – $6.41 range), reflecting heightened intraday volatility and notable selling pressure after the open. This creates a divergence between longer-term momentum (bullish) and short-term overbought, weakening price action.
Consolidation outlook as bullish signals limit downside risk
For the next five trading days, the expected price range is $6.10 – $6.45, reflecting typical weekly volatility and adjusted for the current price. There is a very high probability (more than 80%) of a price increase, with the downside being less likely given the dominance of bullish signals from the weekly Moving Averages, RSI, and MACD. The baseline scenario is for consolidation within the $6.10 – $6.45 corridor. A bullish case unfolds on a break above $6.45, confirming fresh upward momentum, while a bearish scenario materializes if the price dips below $6.10, risking a correction toward dynamic support at $5.50.
JetBlue Airways Corporation is currently trading above its key moving averages, indicating strong bullish momentum across short-, medium-, and long-term trends, with dynamic support near $5.50 and resistance around the $6.50 level. However, multiple overbought technical indicators and modest trend strength suggest buyers may be losing steam, raising the potential for near-term consolidation despite ongoing upside momentum signals.


Latest JetBlue News


-
 Afghanistan
-
 Albania
-
 Algeria
-
 Angola
-
 Argentina
-
 Armenia
-
 Australia
-
 Austria
-
 Azerbaijan
-
 Bahamas
-
 Bahrain
-
 Bangladesh
-
 Belarus
-
 Belgium
-
 Bolivia
-
 Botswana
-
 Brazil
-
 Brunei
-
 Bulgaria
-
 Cambodia
-
 Cameroon
-
 Canada
-
 Chile
Chile
-
 China
China
-
 Colombia
-
 Congo
Congo
-
 Costa Rica
-
 Cote d'Ivoire
-
 Croatia
-
 Cuba
Cuba
-
 Cyprus
-
 Czechia
-
 DR Congo
-
 Denmark
-
 Dominican Republic
-
 Ecuador
-
 Egypt
Egypt
-
 El Salvador
-
 Estonia
-
 Eswatini
-
 Ethiopia
-
 Finland
-
 France
-
 Georgia
-
 Germany
-
 Ghana
Ghana
-
 Greece
-
 Haiti
Haiti
-
 Hong Kong
-
 Hungary
-
 India
India
-
 Indonesia
-
 Iran, Islamic republic
-
 Iraq
Iraq
-
 Ireland
-
 Israel
-
 Italy
Italy
-
 Jamaica
-
 Japan
Japan
-
 Jordan
-
 Kazakhstan
-
 Kenya
Kenya
-
 Korea
Korea
-
 Kuwait
-
 Kyrgyzstan
-
 Laos
Laos
-
 Latvia
-
 Lebanon
-
 Lesotho
-
 Libya
Libya
-
 Lithuania
-
 Luxembourg
-
 Madagascar
-
 Malaysia
-
 Malta
Malta
-
 Mauritius
-
 Mexico
-
 Moldova
-
 Mongolia
-
 Montenegro
-
 Morocco
-
 Mozambique
-
 Myanmar
-
 Namibia
-
 Nepal
Nepal
-
 Netherlands
-
 New Zealand
-
 Nigeria
-
 North Macedonia
-
 Norway
-
 Oman
Oman
-
 Pakistan
-
 Palestine
-
 Panama
-
 Papua New Guinea
-
 Paraguay
-
 Peru
Peru
-
 Philippines
-
 Poland
-
 Portugal
-
 Puerto Rico
-
 Qatar
Qatar
-
 Reunion
-
 Romania
-
 Rwanda
-
 Saudi Arabia
-
 Serbia
-
 Singapore
-
 Slovakia
-
 Slovenia
-
 Somalia
-
 South Africa
-
 Spain
Spain
-
 Sri Lanka
-
 Sweden
-
 Switzerland
-
 Syria
Syria
-
 Taiwan
-
 Tajikistan
-
 Tanzania
-
 Thailand
-
 Trinidad and Tobago
-
 Tunisia
-
 Turkey
-
 UAE
UAE
-
 Uganda
-
 Ukraine
-
 United Kingdom
-
United States
-
 Uruguay
-
 Uzbekistan
-
 Venezuela
-
 Vietnam
-
 Yemen
Yemen
-
 Zambia
-
 Zimbabwe
- Forex
- Crypto
