
AMD stock price forecast: Sideways pattern expected as AMD trades above key support

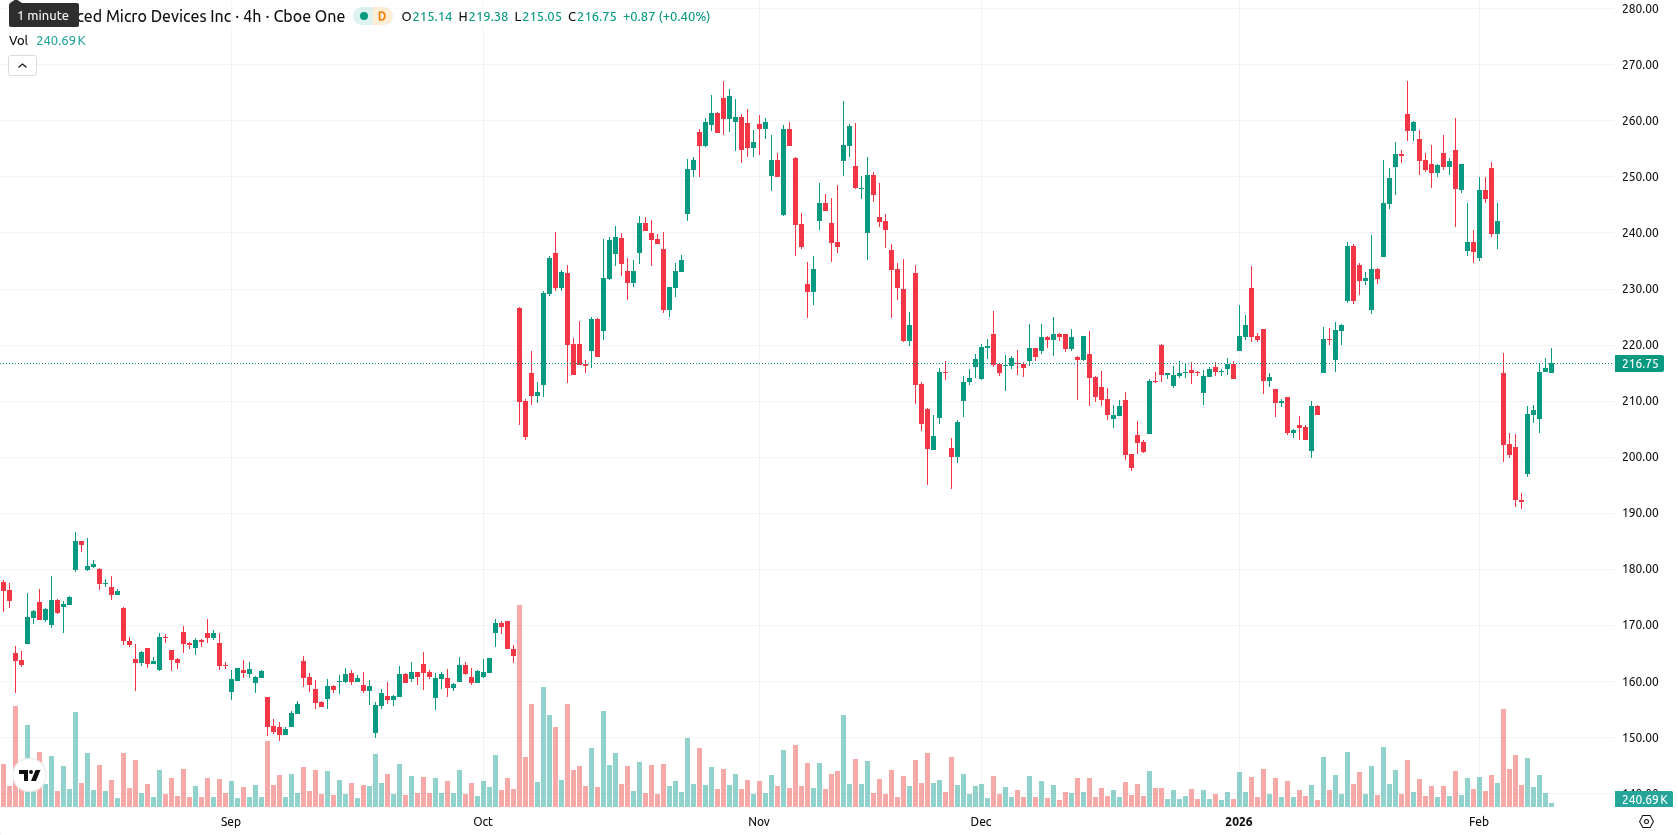
Advanced Micro Devices, Inc. (AMD) is trading at $216.49, which is below both the MA-20 ($232.88) and MA-50 ($221.66), but well above the MA-200 ($179.66), reflecting short- and medium-term pressure from sellers while preserving long-term bullish structure. The nearest dynamic resistance is set by the Ichimoku Kijun at $228.81, while MA-200 continues to provide substantial longer-term support.
Highlights
- AMD trades at $216.49, below the MA-20 ($232.88) and MA-50 ($221.66), but remains well above the MA-200 ($179.66), indicating long-term bullish structure despite short-term pressure.
- Momentum indicators are mixed, with MACD and ADX neutral while RSI (45.14), Stochastic RSI (29.49), and CCI (-80.37) show oversold or slightly bearish signals, and intraday sellers retaining control.
- The expected five-day trading range is $212.66–$220.50, with an 80%+ probability of upward movement unless price breaks below $212.66 support, while resistance sits at $220.50–$228.81.
Mixed momentum as daily indicators flag mild downside bias
Momentum indicators show conflicting signals: MACD and ADX are neutral on the daily frame, suggesting the current move lacks conviction, while RSI (45.14), Stochastic RSI (29.49), and CCI (-80.37) all point to slight bearish or oversold tendencies. Bull/Bear Power is firmly in oversold territory, indicating that sellers retain the upper hand intraday despite a mild gain of $0.49 or 0.23% above Friday's close. There was no meaningful gap between the previous close ($216.00) and today's open ($215.25). The current price sits near the midpoint of the day’s range ($215.12 – $219.18), with intraday volatility remaining moderate and price direction showing a slight upward bias but clear lack of strong momentum confirmation.
High odds of upside as weekly signals favor bullish scenario
For the next five trading days, the expected range is $212.66 to $220.50. Based on the alignment of weekly signals (all major weekly trend indicators are on “Buy” or “Strong Buy”), there is a very high probability (more than 80%) of an upward move, with the probability of a decline considered very low. In the baseline scenario, AMD is likely to continue trading sideways between $212.66 and $220.50. A bullish scenario could see the price break above resistance at $220.50 – $228.81 if momentum returns, while a bearish break below support at $212.66 would signal further short-term pressure but remains unlikely given the underlying weekly trend.
Last time, analysts noted that AMD is trading below its short- and medium-term moving averages while remaining well above its long-term average, reflecting ongoing short-term selling pressure but a sustained long-term uptrend. Key technical indicators present mixed signals: despite developing oversold conditions and strong intraday momentum, momentum and trend measures remain neutral to weak, with price likely to consolidate between established support and resistance levels.


Latest AMD News


-
 Afghanistan
-
 Albania
-
 Algeria
-
 Angola
-
 Argentina
-
 Armenia
-
 Australia
-
 Austria
-
 Azerbaijan
-
 Bahamas
-
 Bahrain
-
 Bangladesh
-
 Belarus
-
 Belgium
-
 Bolivia
-
 Botswana
-
 Brazil
-
 Brunei
-
 Bulgaria
-
 Cambodia
-
 Cameroon
-
 Canada
-
 Chile
Chile
-
 China
China
-
 Colombia
-
 Congo
Congo
-
 Costa Rica
-
 Cote d'Ivoire
-
 Croatia
-
 Cuba
Cuba
-
 Cyprus
-
 Czechia
-
 DR Congo
-
 Denmark
-
 Dominican Republic
-
 Ecuador
-
 Egypt
Egypt
-
 El Salvador
-
 Estonia
-
 Eswatini
-
 Ethiopia
-
 Finland
-
 France
-
 Georgia
-
 Germany
-
 Ghana
Ghana
-
 Greece
-
 Haiti
Haiti
-
 Hong Kong
-
 Hungary
-
 India
India
-
 Indonesia
-
 Iran, Islamic republic
-
 Iraq
Iraq
-
 Ireland
-
 Israel
-
 Italy
Italy
-
 Jamaica
-
 Japan
Japan
-
 Jordan
-
 Kazakhstan
-
 Kenya
Kenya
-
 Korea
Korea
-
 Kuwait
-
 Kyrgyzstan
-
 Laos
Laos
-
 Latvia
-
 Lebanon
-
 Lesotho
-
 Libya
Libya
-
 Lithuania
-
 Luxembourg
-
 Madagascar
-
 Malaysia
-
 Malta
Malta
-
 Mauritius
-
 Mexico
-
 Moldova
-
 Mongolia
-
 Montenegro
-
 Morocco
-
 Mozambique
-
 Myanmar
-
 Namibia
-
 Nepal
Nepal
-
 Netherlands
-
 New Zealand
-
 Nigeria
-
 North Macedonia
-
 Norway
-
 Oman
Oman
-
 Pakistan
-
 Palestine
-
 Panama
-
 Papua New Guinea
-
 Paraguay
-
 Peru
Peru
-
 Philippines
-
 Poland
-
 Portugal
-
 Puerto Rico
-
 Qatar
Qatar
-
 Reunion
-
 Romania
-
 Rwanda
-
 Saudi Arabia
-
 Serbia
-
 Singapore
-
 Slovakia
-
 Slovenia
-
 Somalia
-
 South Africa
-
 Spain
Spain
-
 Sri Lanka
-
 Sweden
-
 Switzerland
-
 Syria
Syria
-
 Taiwan
-
 Tajikistan
-
 Tanzania
-
 Thailand
-
 Trinidad and Tobago
-
 Tunisia
-
 Turkey
-
 UAE
UAE
-
 Uganda
-
 Ukraine
-
 United Kingdom
-
United States
-
 Uruguay
-
 Uzbekistan
-
 Venezuela
-
 Vietnam
-
 Yemen
Yemen
-
 Zambia
-
 Zimbabwe
- Forex
- Crypto
