
Oversold signals and weak momentum — Affirm stock gains 4.89%

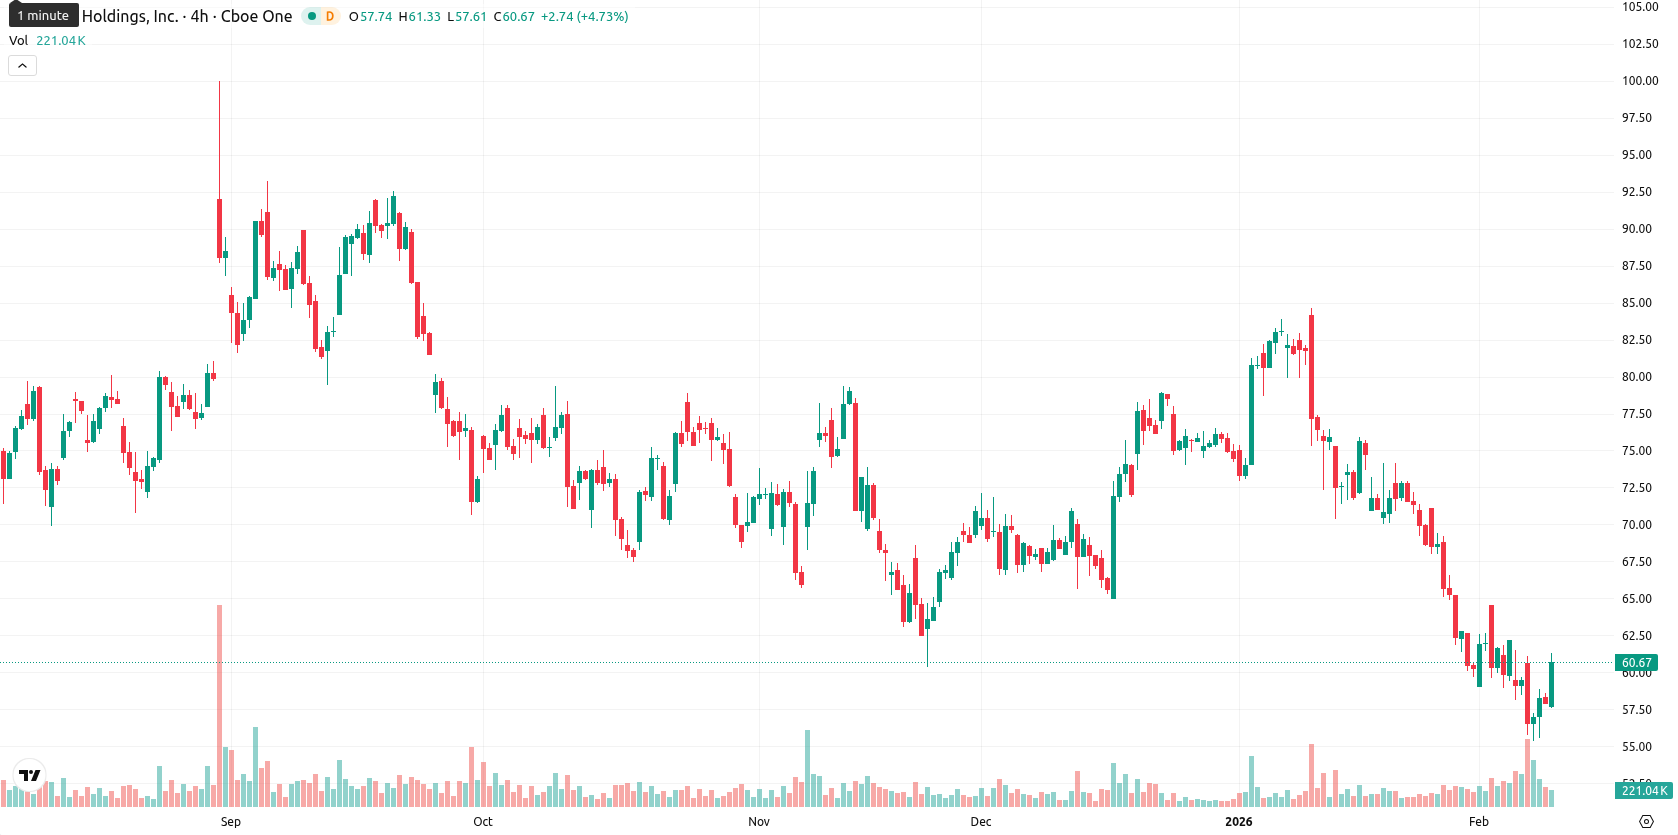
Affirm Holdings, Inc. (AFRM) is trading at $60.78 after rising 4.89% intraday, with the price still positioned below the MA-20 ($67.24), MA-50 ($71.00), and MA-200 ($69.28). This places Affirm beneath all key moving averages, indicating continued downside pressure across short, medium, and long-term trends.
Highlights
- Allen Holding Inc. NY reduced its stake in Affirm Holdings by 9.9% in Q3, selling 25,262 shares and retaining 230,000 shares.
- This sale reflects modest portfolio rebalancing activity involving Affirm Holdings, with the institution maintaining a substantial position after the reduction.
- Affirm ($AFRM) trades at $60.78, below MA-20 ($67.24), MA-50 ($71.00), and MA-200 ($69.28), indicating persistent downside pressure and likely consolidation between $57.00–$63.50.
Share reduction signals tempered institutional confidence in affirm
Allen Holding Inc. NY reduced its stake in Affirm by 9.9% during the third quarter, selling 25,262 shares and retaining 230,000 shares in the company. This corporate action reflects modest portfolio rebalancing activity involving Affirm Holdings.
Bearish momentum persists amid oversold signals and resistance barriers
Technically, Affirm is trading well below major moving averages, with dynamic resistance at the Ichimoku Kijun (D1 $70.03) and nearest support at the Hull Moving Average (HMA-D1 $57.67). Momentum indicators including MACD and ADX show limited directional strength and persistent bearish momentum, while oscillators such as the RSI (30.29), Stochastic RSI (13.89), CCI (–116.29), and Bull/Bear Power (–4.44) flag oversold conditions and ongoing seller dominance. The Awesome Oscillator also supports the bearish outlook, as the intraday rebound contrasts with broadly weak underlying momentum.
Sideways consolidation likely as low rebound odds temper outlook
In the short term, Affirm is expected to trade within a $57.00 – $63.50 volatility band relative to current levels. Given the prevailing technical setup and continued oversold conditions, there is less than a 20% probability of a sustained price increase. The baseline scenario is sideways consolidation between $57.00 and $63.50, while a move above $63.50 would signal a test of nearby resistance, and a break below $57.00 could invite further downside toward the $55.00 psychological support area.
Previously it was reported that Affirm Holdings, Inc. is trading below all key moving averages, with ongoing downward technical pressure despite a modest intraday bounce. While momentum indicators and oscillators show oversold conditions and waning bearish momentum, the lack of strong trend and absence of nearby support suggest the broader outlook remains weak pending a decisive move above resistance.


Latest Affirm News


-
 Afghanistan
-
 Albania
-
 Algeria
-
 Angola
-
 Argentina
-
 Armenia
-
 Australia
-
 Austria
-
 Azerbaijan
-
 Bahamas
-
 Bahrain
-
 Bangladesh
-
 Belarus
-
 Belgium
-
 Bolivia
-
 Botswana
-
 Brazil
-
 Brunei
-
 Bulgaria
-
 Cambodia
-
 Cameroon
-
 Canada
-
 Chile
Chile
-
 China
China
-
 Colombia
-
 Congo
Congo
-
 Costa Rica
-
 Cote d'Ivoire
-
 Croatia
-
 Cuba
Cuba
-
 Cyprus
-
 Czechia
-
 DR Congo
-
 Denmark
-
 Dominican Republic
-
 Ecuador
-
 Egypt
Egypt
-
 El Salvador
-
 Estonia
-
 Eswatini
-
 Ethiopia
-
 Finland
-
 France
-
 Georgia
-
 Germany
-
 Ghana
Ghana
-
 Greece
-
 Haiti
Haiti
-
 Hong Kong
-
 Hungary
-
 India
India
-
 Indonesia
-
 Iran, Islamic republic
-
 Iraq
Iraq
-
 Ireland
-
 Israel
-
 Italy
Italy
-
 Jamaica
-
 Japan
Japan
-
 Jordan
-
 Kazakhstan
-
 Kenya
Kenya
-
 Korea
Korea
-
 Kuwait
-
 Kyrgyzstan
-
 Laos
Laos
-
 Latvia
-
 Lebanon
-
 Lesotho
-
 Libya
Libya
-
 Lithuania
-
 Luxembourg
-
 Madagascar
-
 Malaysia
-
 Malta
Malta
-
 Mauritius
-
 Mexico
-
 Moldova
-
 Mongolia
-
 Montenegro
-
 Morocco
-
 Mozambique
-
 Myanmar
-
 Namibia
-
 Nepal
Nepal
-
 Netherlands
-
 New Zealand
-
 Nigeria
-
 North Macedonia
-
 Norway
-
 Oman
Oman
-
 Pakistan
-
 Palestine
-
 Panama
-
 Papua New Guinea
-
 Paraguay
-
 Peru
Peru
-
 Philippines
-
 Poland
-
 Portugal
-
 Puerto Rico
-
 Qatar
Qatar
-
 Reunion
-
 Romania
-
 Rwanda
-
 Saudi Arabia
-
 Serbia
-
 Singapore
-
 Slovakia
-
 Slovenia
-
 Somalia
-
 South Africa
-
 Spain
Spain
-
 Sri Lanka
-
 Sweden
-
 Switzerland
-
 Syria
Syria
-
 Taiwan
-
 Tajikistan
-
 Tanzania
-
 Thailand
-
 Trinidad and Tobago
-
 Tunisia
-
 Turkey
-
 UAE
UAE
-
 Uganda
-
 Ukraine
-
 United Kingdom
-
United States
-
 Uruguay
-
 Uzbekistan
-
 Venezuela
-
 Vietnam
-
 Yemen
Yemen
-
 Zambia
-
 Zimbabwe
- Forex
- Crypto
