
-3.50% for Nano Dimension stock — intraday pressure offsets bullish trend signals

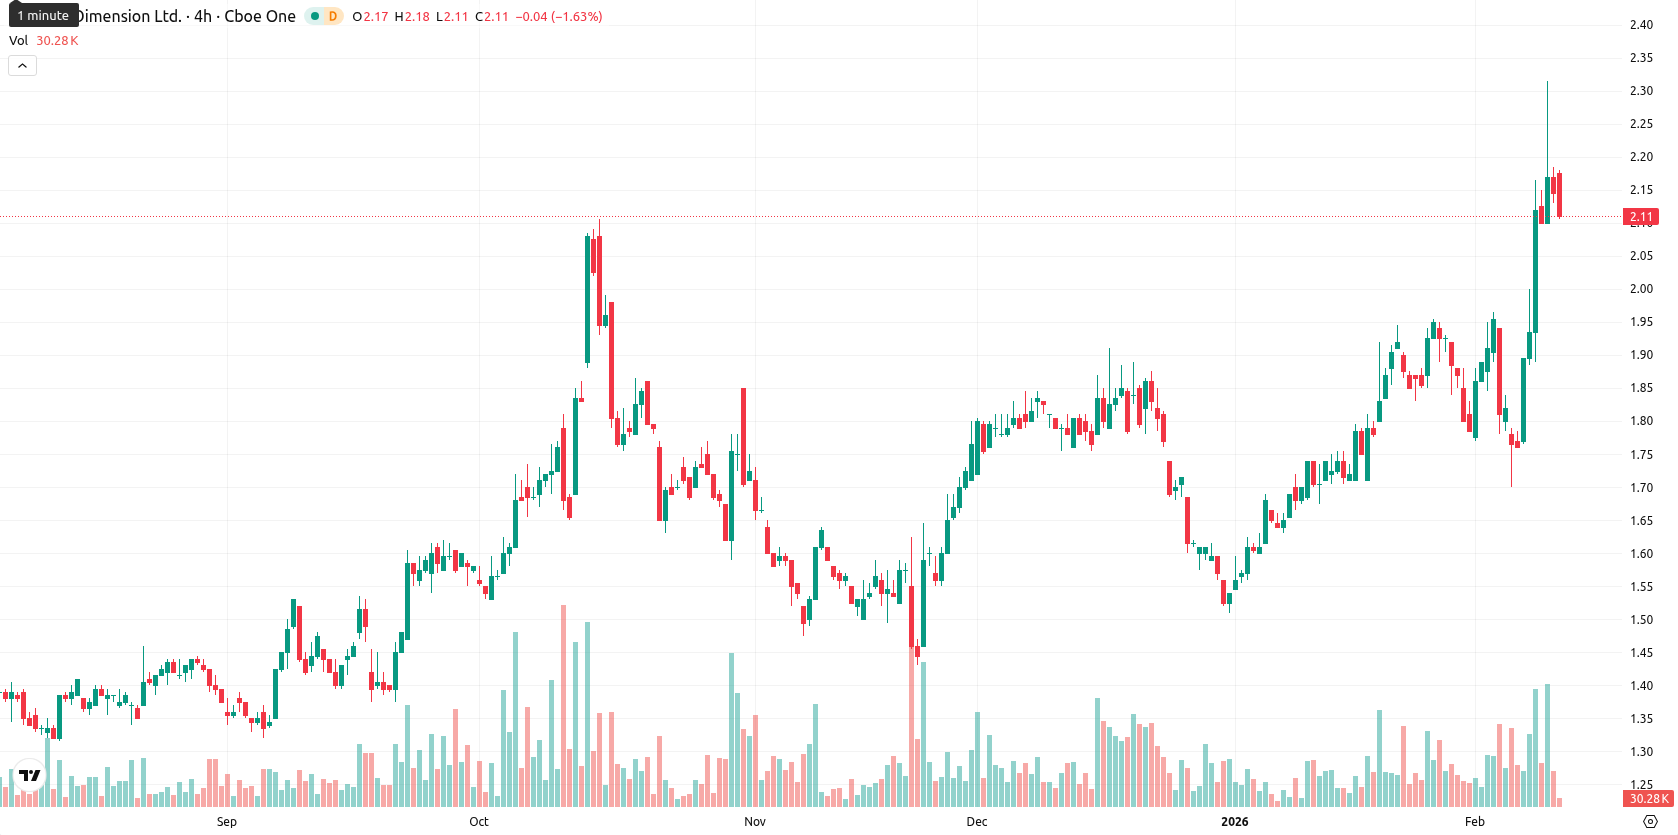
Nano Dimension Ltd. (NNDM) is currently trading at $2.07, marking a decline from the intraday high but maintaining a level well above the short-, medium-, and long-term moving averages. The asset opened with a modest gap up and presently sits near the lower end of today’s price range, demonstrating that bullish trends remain in place according to recent price action.
Highlights
- The current price of $2.07 is above MA-20 ($1.87), MA-50 ($1.78), and MA-200 ($1.60), confirming bullish momentum across all timeframes.
- Key support sits at the Ichimoku Kijun around $1.94, with resistance at the MA-50 and the psychological $2.20 level.
- Technical indicators show upside pressure and a high probability (>80%) of further price increase, with consolidation likely between $1.95–$2.20 in the next 5 days.
Bullish bias confirmed as price nears support and momentum divides
The current price of $2.07 is well above the MA-20 ($1.87), MA-50 ($1.78), and MA-200 ($1.60), confirming that short-, medium-, and long-term trends remain bullish. The nearest dynamic support is seen at the Ichimoku Kijun around $1.94, while resistance is likely near the MA-50 or the $2.20 round level.
Momentum indicators show continued upside pressure, with both the MACD and ADX confirming a Buy outlook, though the ADX reading suggests the trend is not especially strong. The RSI stands at 66.43 and CCI is overbought at 268.18, but the Stochastic RSI on the daily timeframe gives a neutral signal, indicating mixed short-term overbought/oversold conditions. Bull/Bear Power is in buyers' territory, supporting the bullish intraday mood, while the Awesome Oscillator also aligns with upward momentum. The price started today with a slight gap up from the previous close ($2.14 to $2.18), but has since drifted down, now sitting closer to the lower end of today’s range ($2.05–$2.18). Volatility is moderate and intraday tone suggests price pressure after the open, with some divergence visible between trending and oscillating indicators.
High probability of gains as consolidation sets bullish breakout stage
Looking ahead, the expected range for the next 5 trading days is normalized to around $1.95–$2.20, reflecting the elevated volatility and consistent bullish trend. There is a very high probability (more than 80%) of a price increase, with a decrease much less likely under current conditions. The baseline scenario is price consolidation between support at $1.95 and resistance at $2.20. A bullish outcome would see a breakout above resistance, potentially triggering further momentum toward $2.25. The bearish scenario, though less likely, would require a break below support at $1.95, opening the way for a pullback toward the 20-day average.
Previously it was reported that Nano Dimension Ltd. is trading above key moving averages, reflecting a sustained bullish trend across timeframes, while daily momentum indicators such as MACD and ADX remain strong but RSI and CCI signal emerging overbought conditions. Short-term price action shows a pullback toward dynamic support at $1.94 amid moderate volatility, with resistance seen around $2.20, as intraday signals turn mixed despite overarching positive momentum.


Latest Nano Dimension News


-
 Afghanistan
-
 Albania
-
 Algeria
-
 Angola
-
 Argentina
-
 Armenia
-
 Australia
-
 Austria
-
 Azerbaijan
-
 Bahamas
-
 Bahrain
-
 Bangladesh
-
 Belarus
-
 Belgium
-
 Bolivia
-
 Botswana
-
 Brazil
-
 Brunei
-
 Bulgaria
-
 Cambodia
-
 Cameroon
-
 Canada
-
 Chile
Chile
-
 China
China
-
 Colombia
-
 Congo
Congo
-
 Costa Rica
-
 Cote d'Ivoire
-
 Croatia
-
 Cuba
Cuba
-
 Cyprus
-
 Czechia
-
 DR Congo
-
 Denmark
-
 Dominican Republic
-
 Ecuador
-
 Egypt
Egypt
-
 El Salvador
-
 Estonia
-
 Eswatini
-
 Ethiopia
-
 Finland
-
 France
-
 Georgia
-
 Germany
-
 Ghana
Ghana
-
 Greece
-
 Haiti
Haiti
-
 Hong Kong
-
 Hungary
-
 India
India
-
 Indonesia
-
 Iran, Islamic republic
-
 Iraq
Iraq
-
 Ireland
-
 Israel
-
 Italy
Italy
-
 Jamaica
-
 Japan
Japan
-
 Jordan
-
 Kazakhstan
-
 Kenya
Kenya
-
 Korea
Korea
-
 Kuwait
-
 Kyrgyzstan
-
 Laos
Laos
-
 Latvia
-
 Lebanon
-
 Lesotho
-
 Libya
Libya
-
 Lithuania
-
 Luxembourg
-
 Madagascar
-
 Malaysia
-
 Malta
Malta
-
 Mauritius
-
 Mexico
-
 Moldova
-
 Mongolia
-
 Montenegro
-
 Morocco
-
 Mozambique
-
 Myanmar
-
 Namibia
-
 Nepal
Nepal
-
 Netherlands
-
 New Zealand
-
 Nigeria
-
 North Macedonia
-
 Norway
-
 Oman
Oman
-
 Pakistan
-
 Palestine
-
 Panama
-
 Papua New Guinea
-
 Paraguay
-
 Peru
Peru
-
 Philippines
-
 Poland
-
 Portugal
-
 Puerto Rico
-
 Qatar
Qatar
-
 Reunion
-
 Romania
-
 Rwanda
-
 Saudi Arabia
-
 Serbia
-
 Singapore
-
 Slovakia
-
 Slovenia
-
 Somalia
-
 South Africa
-
 Spain
Spain
-
 Sri Lanka
-
 Sweden
-
 Switzerland
-
 Syria
Syria
-
 Taiwan
-
 Tajikistan
-
 Tanzania
-
 Thailand
-
 Trinidad and Tobago
-
 Tunisia
-
 Turkey
-
 UAE
UAE
-
 Uganda
-
 Ukraine
-
 United Kingdom
-
United States
-
 Uruguay
-
 Uzbekistan
-
 Venezuela
-
 Vietnam
-
 Yemen
Yemen
-
 Zambia
-
 Zimbabwe
- Forex
- Crypto
