
Texas Instruments stock gains 3.22% as strong earnings and momentum fuel rally

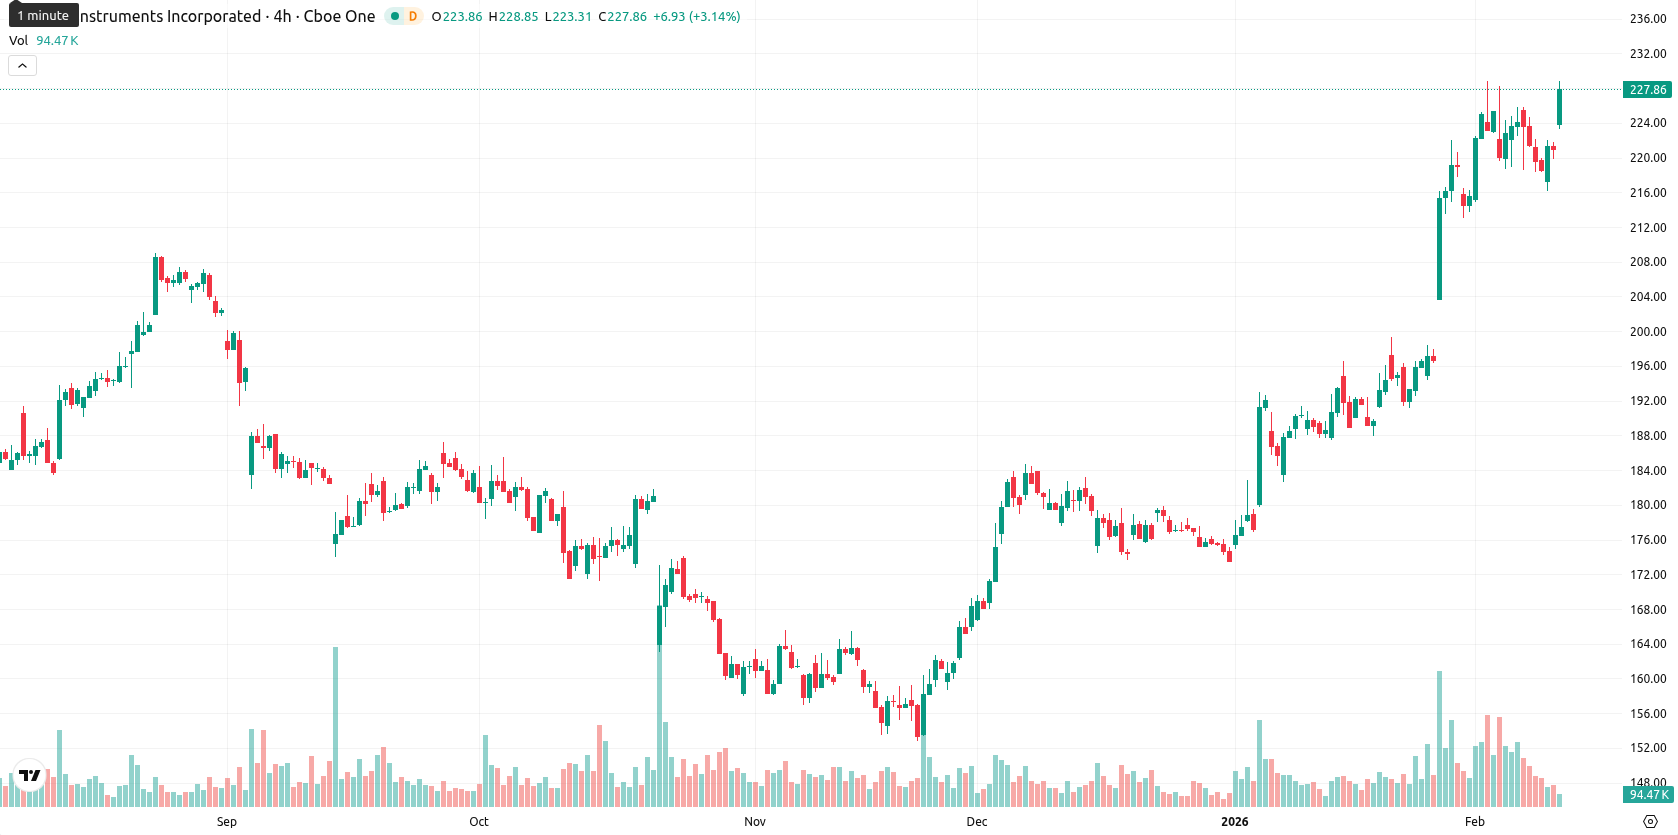
Texas Instruments Incorporated (TXN) is trading at $228.14, well above the MA-20 ($206.88), MA-50 ($190.30), and MA-200 ($186.34), which confirms persistent bullish trends in the short, medium, and long term. With the price positioned far above the Ichimoku Kijun level ($202.86), dynamic support is provided at that Kijun band, while resistance is now defined by the recent highs or the next round number near $230.
Highlights
- Texas Instruments reported Q4 revenue of $4.42 billion and earnings per share of $1.27, forecasting Q1 revenue between $4.32 billion and $4.68 billion.
- Providence Capital Advisors LLC initiated a $6.35 million investment in the company, which maintains a 2.6% dividend yield and a consistent history of dividend growth.
- TXN is trading at $228.14, well above major moving averages, with short-term support at $224.75 and resistance at $231.50, reflecting strong bullish momentum.
Shareholder returns grow as revenue outlook and investing boost sentiment
Texas Instruments reported $4.42 billion in fourth-quarter revenue and $1.27 in earnings per share in its late-January results. Management also outlined expected first-quarter revenue between $4.32 billion and $4.68 billion, while highlighting significant capacity investments and strong cash returns to shareholders. Providence Capital Advisors LLC recently made a new $6.35 million investment, acquiring 34,543 shares. The company remains recognized for its history of consistent dividend increases, now yielding 2.6%.
Overbought signals emerge as daily momentum outpaces volatility
Bullish momentum remains strong, as both the MACD and ADX on the daily chart indicate active buying interest. The RSI approaches overbought territory (69.00) and the Stochastic RSI is neutral, while the Commodity Channel Index signals mild overbought conditions; Bull/Bear Power highlights dominant buyer activity across all lower timeframes, confirming strong intraday momentum. The daily advance of 3.22% (up $7.11) was accompanied by a modest gap at the open ($224.22 vs prior close $221.03), with the current price hovering near today’s high and reflecting moderate intraday volatility, as well as strength toward session highs. This broad bullish momentum is mostly reinforced by the oscillators, with only minor divergences coming from short-term intraday overbought signals.
Upside favored as breakout risk and consolidation zone define outlook
For the next five trading days, the expected price corridor is $224.75 – $231.51. The probability of a further price increase is very high (more than 80%), while the likelihood of a decline is very low (less than 20%). The baseline scenario sees TXN consolidating between recent support ($224.75) and resistance ($231.50). In a bullish scenario, a break above $231.50 may trigger further gains toward additional round-number resistance levels, while a drop below $224.75 would suggest only a short-lived pullback given prevailing momentum.
Last time, analysts noted that Texas Instruments is exhibiting pronounced bullish momentum, trading significantly above its key moving averages with technical indicators such as MACD and ADX reinforcing a strong upward trend, while institutional investors continue to accumulate shares. However, with the RSI, CCI, and Stochastic RSI registering overbought conditions and price volatility elevated, near-term consolidation or a pullback is possible as the stock approaches resistance.


Latest Texas Instruments News


-
 Afghanistan
-
 Albania
-
 Algeria
-
 Angola
-
 Argentina
-
 Armenia
-
 Australia
-
 Austria
-
 Azerbaijan
-
 Bahamas
-
 Bahrain
-
 Bangladesh
-
 Belarus
-
 Belgium
-
 Bolivia
-
 Botswana
-
 Brazil
-
 Brunei
-
 Bulgaria
-
 Cambodia
-
 Cameroon
-
 Canada
-
 Chile
Chile
-
 China
China
-
 Colombia
-
 Congo
Congo
-
 Costa Rica
-
 Cote d'Ivoire
-
 Croatia
-
 Cuba
Cuba
-
 Cyprus
-
 Czechia
-
 DR Congo
-
 Denmark
-
 Dominican Republic
-
 Ecuador
-
 Egypt
Egypt
-
 El Salvador
-
 Estonia
-
 Eswatini
-
 Ethiopia
-
 Finland
-
 France
-
 Georgia
-
 Germany
-
 Ghana
Ghana
-
 Greece
-
 Haiti
Haiti
-
 Hong Kong
-
 Hungary
-
 India
India
-
 Indonesia
-
 Iran, Islamic republic
-
 Iraq
Iraq
-
 Ireland
-
 Israel
-
 Italy
Italy
-
 Jamaica
-
 Japan
Japan
-
 Jordan
-
 Kazakhstan
-
 Kenya
Kenya
-
 Korea
Korea
-
 Kuwait
-
 Kyrgyzstan
-
 Laos
Laos
-
 Latvia
-
 Lebanon
-
 Lesotho
-
 Libya
Libya
-
 Lithuania
-
 Luxembourg
-
 Madagascar
-
 Malaysia
-
 Malta
Malta
-
 Mauritius
-
 Mexico
-
 Moldova
-
 Mongolia
-
 Montenegro
-
 Morocco
-
 Mozambique
-
 Myanmar
-
 Namibia
-
 Nepal
Nepal
-
 Netherlands
-
 New Zealand
-
 Nigeria
-
 North Macedonia
-
 Norway
-
 Oman
Oman
-
 Pakistan
-
 Palestine
-
 Panama
-
 Papua New Guinea
-
 Paraguay
-
 Peru
Peru
-
 Philippines
-
 Poland
-
 Portugal
-
 Puerto Rico
-
 Qatar
Qatar
-
 Reunion
-
 Romania
-
 Rwanda
-
 Saudi Arabia
-
 Serbia
-
 Singapore
-
 Slovakia
-
 Slovenia
-
 Somalia
-
 South Africa
-
 Spain
Spain
-
 Sri Lanka
-
 Sweden
-
 Switzerland
-
 Syria
Syria
-
 Taiwan
-
 Tajikistan
-
 Tanzania
-
 Thailand
-
 Trinidad and Tobago
-
 Tunisia
-
 Turkey
-
 UAE
UAE
-
 Uganda
-
 Ukraine
-
 United Kingdom
-
United States
-
 Uruguay
-
 Uzbekistan
-
 Venezuela
-
 Vietnam
-
 Yemen
Yemen
-
 Zambia
-
 Zimbabwe
- Forex
- Crypto
