
-5.47% for Affirm stock — heavy selling pressure and oversold signals drive downside

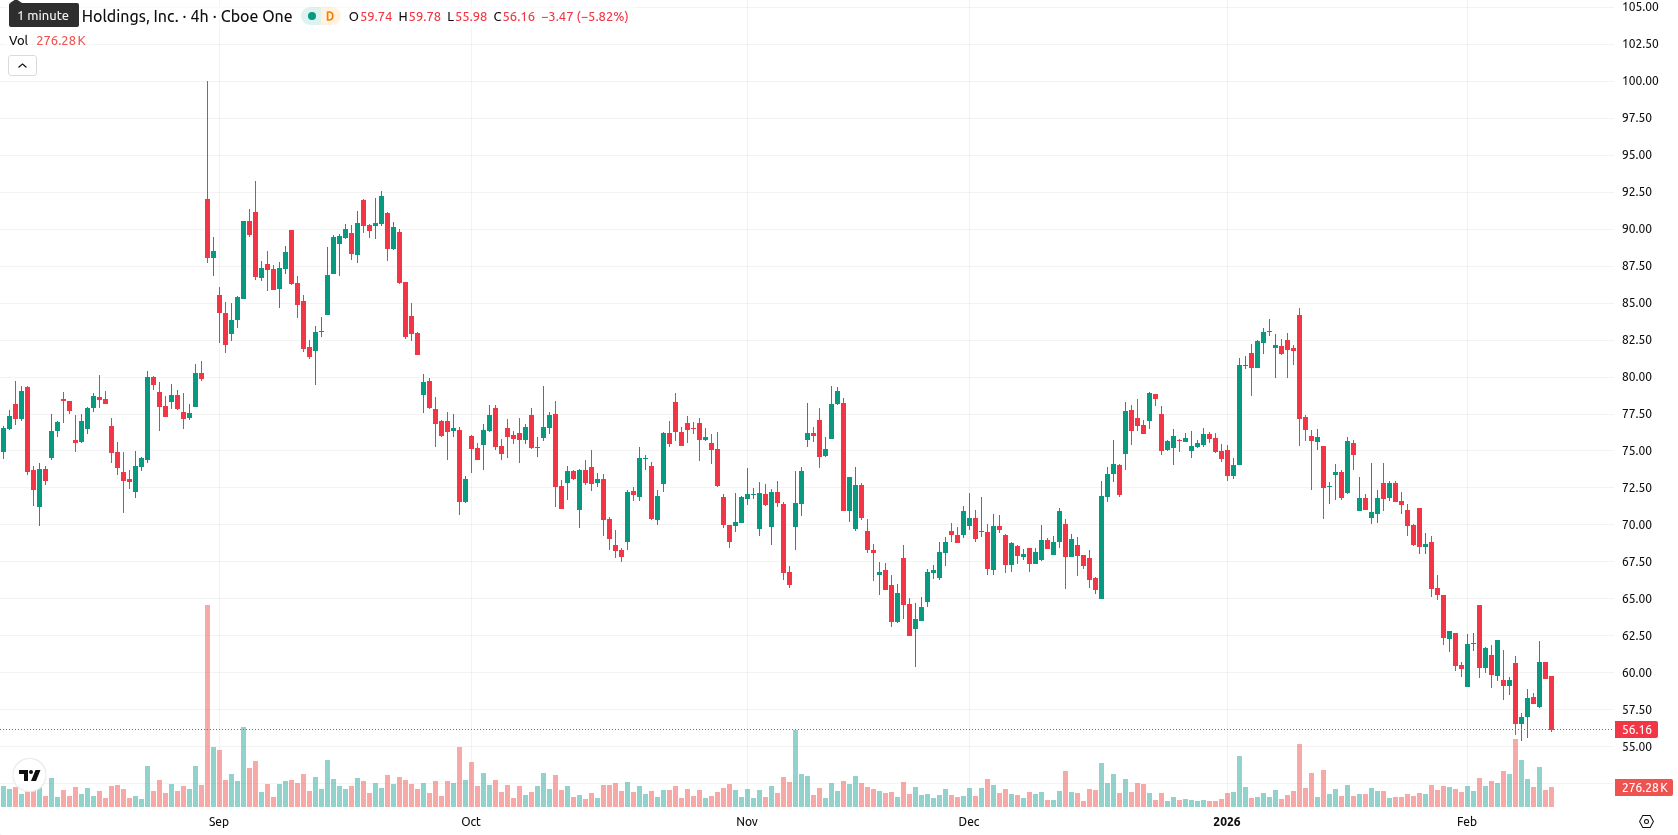
Affirm Holdings, Inc. (AFRM) is trading at $56.39, marking a 5.47% decline intraday and positioning the asset well below its MA-20 ($66.40), MA-50 ($70.81), and MA-200 ($69.34) — a clear sign of persistent downside pressure across all main trends.
Highlights
- Affirm announced new partnerships with Intuit's QuickBooks Payments, Expedia Group, Bolt, and extended its Wayfair collaboration into the UK and Canada, broadening sector and geographic reach.
- The February 5, 2026 expansion with Wayfair reflects Affirm's strategic push into international markets for its Buy Now, Pay Later solutions.
- AFRM is trading at $56.39, well below its MA-20 ($66.40) and MA-50 ($70.81), with momentum indicators signaling bearish pressure and a likely $53.50–$58.50 trading range.
Geographic expansion accelerates as new partnerships bolster global reach
Affirm has recently announced several new partnerships and expansions, including agreements with Intuit's QuickBooks Payments, Expedia Group, Bolt, and Wayfair, significantly broadening its reach across financial software, travel, ecommerce, and home goods retail. The expansion of its partnership with Wayfair into the United Kingdom and Canada, disclosed on February 5, 2026, highlights strategic growth for Affirm's Buy Now, Pay Later offerings in international markets. These corporate actions reflect continued efforts by Affirm to strengthen its presence in both North America and key overseas regions.
Dynamic resistance persists amid oversold signals and heightened volatility
AFRM remains well below key moving averages (MA-20, MA-50, MA-200) and faces dynamic resistance at the Ichimoku Kijun level of $70.03, with support likely found at today's intraday lows. Daily chart momentum indicators confirm ongoing weakness: the MACD is in strong sell mode, ADX shows a weak trend, and the RSI (34.98), Stochastic RSI, CCI, and Bull/Bear Power all signal oversold conditions and dominant selling pressure. The price is tracking close to today’s low of $56.13, indicating high volatility and continued pressure throughout the session.
Constrained upside outlook as tight range holds and momentum wanes
Over the next five trading days, AFRM is likely to remain within a volatility band between $53.50 and $58.50, as upside breakout potential appears low at less than 20%. Most signals point to a continuation of sideways action in this range. A bullish shift would require breaking above $58.50 – $59.50 and establishing new support, while closing below $53.50 could trigger further downside.
Previously it was reported that Affirm Holdings, Inc. trades below all major moving averages, with technical signals such as RSI and MACD indicating oversold conditions and continued downside pressure across all timeframes. Despite today’s sharp intraday rebound reflecting high volatility and a potential loss of seller dominance, persistent resistance levels and lack of nearby support suggest broader bearish momentum remains in place.


Latest Affirm News


-
 Afghanistan
-
 Albania
-
 Algeria
-
 Angola
-
 Argentina
-
 Armenia
-
 Australia
-
 Austria
-
 Azerbaijan
-
 Bahamas
-
 Bahrain
-
 Bangladesh
-
 Belarus
-
 Belgium
-
 Bolivia
-
 Botswana
-
 Brazil
-
 Brunei
-
 Bulgaria
-
 Cambodia
-
 Cameroon
-
 Canada
-
 Chile
Chile
-
 China
China
-
 Colombia
-
 Congo
Congo
-
 Costa Rica
-
 Cote d'Ivoire
-
 Croatia
-
 Cuba
Cuba
-
 Cyprus
-
 Czechia
-
 DR Congo
-
 Denmark
-
 Dominican Republic
-
 Ecuador
-
 Egypt
Egypt
-
 El Salvador
-
 Estonia
-
 Eswatini
-
 Ethiopia
-
 Finland
-
 France
-
 Georgia
-
 Germany
-
 Ghana
Ghana
-
 Greece
-
 Haiti
Haiti
-
 Hong Kong
-
 Hungary
-
 India
India
-
 Indonesia
-
 Iran, Islamic republic
-
 Iraq
Iraq
-
 Ireland
-
 Israel
-
 Italy
Italy
-
 Jamaica
-
 Japan
Japan
-
 Jordan
-
 Kazakhstan
-
 Kenya
Kenya
-
 Korea
Korea
-
 Kuwait
-
 Kyrgyzstan
-
 Laos
Laos
-
 Latvia
-
 Lebanon
-
 Lesotho
-
 Libya
Libya
-
 Lithuania
-
 Luxembourg
-
 Madagascar
-
 Malaysia
-
 Malta
Malta
-
 Mauritius
-
 Mexico
-
 Moldova
-
 Mongolia
-
 Montenegro
-
 Morocco
-
 Mozambique
-
 Myanmar
-
 Namibia
-
 Nepal
Nepal
-
 Netherlands
-
 New Zealand
-
 Nigeria
-
 North Macedonia
-
 Norway
-
 Oman
Oman
-
 Pakistan
-
 Palestine
-
 Panama
-
 Papua New Guinea
-
 Paraguay
-
 Peru
Peru
-
 Philippines
-
 Poland
-
 Portugal
-
 Puerto Rico
-
 Qatar
Qatar
-
 Reunion
-
 Romania
-
 Rwanda
-
 Saudi Arabia
-
 Serbia
-
 Singapore
-
 Slovakia
-
 Slovenia
-
 Somalia
-
 South Africa
-
 Spain
Spain
-
 Sri Lanka
-
 Sweden
-
 Switzerland
-
 Syria
Syria
-
 Taiwan
-
 Tajikistan
-
 Tanzania
-
 Thailand
-
 Trinidad and Tobago
-
 Tunisia
-
 Turkey
-
 UAE
UAE
-
 Uganda
-
 Ukraine
-
 United Kingdom
-
United States
-
 Uruguay
-
 Uzbekistan
-
 Venezuela
-
 Vietnam
-
 Yemen
Yemen
-
 Zambia
-
 Zimbabwe
- Forex
- Crypto
