
Microsoft stock price forecast: Bearish trend persists as MSFT consolidates below key levels

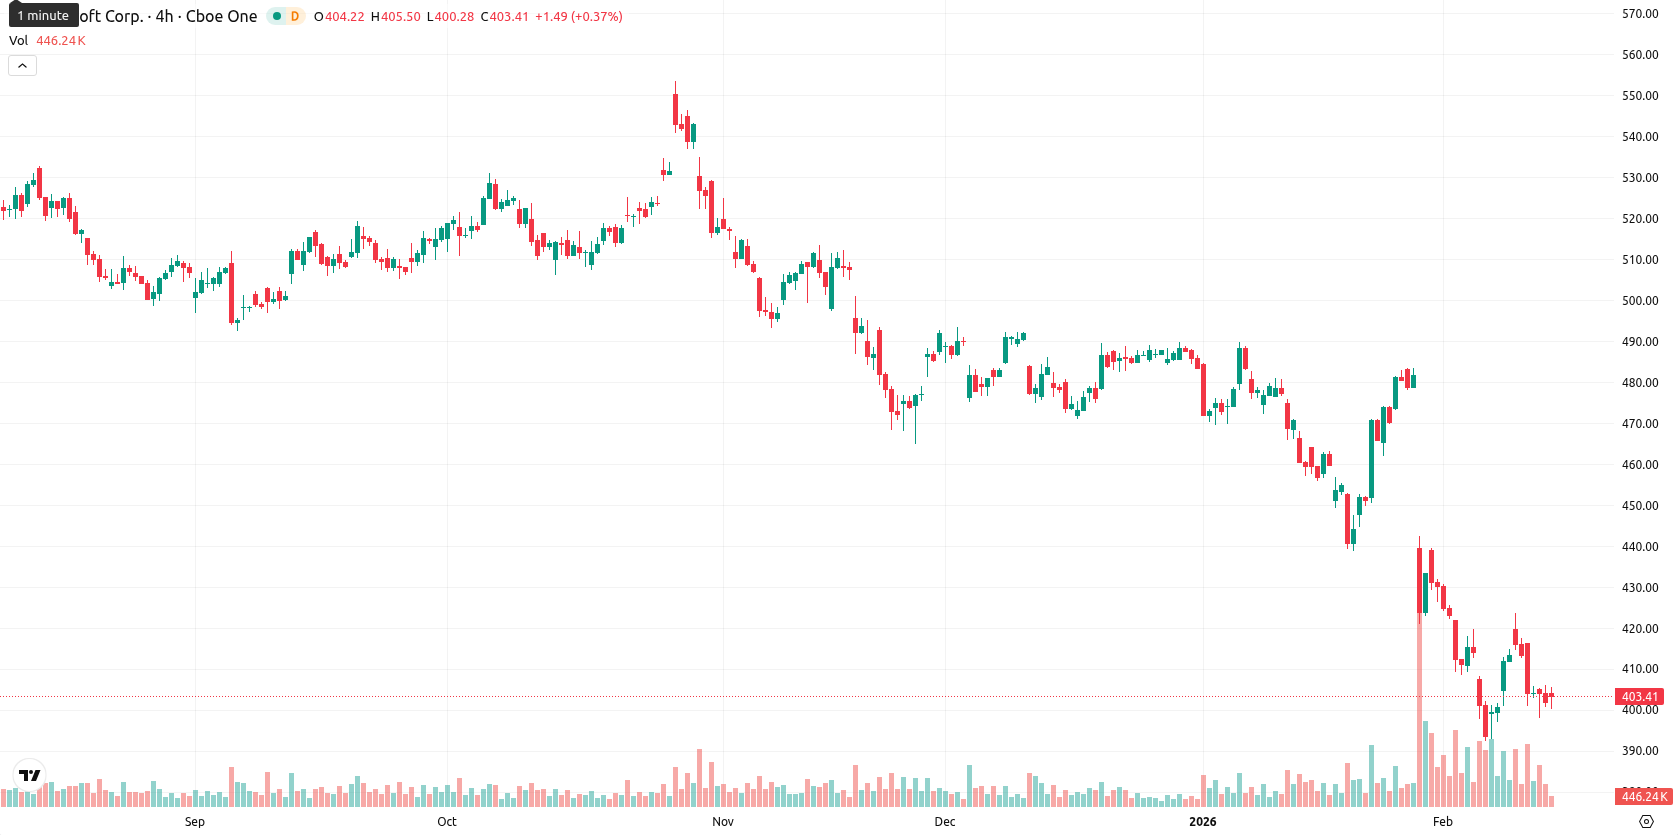
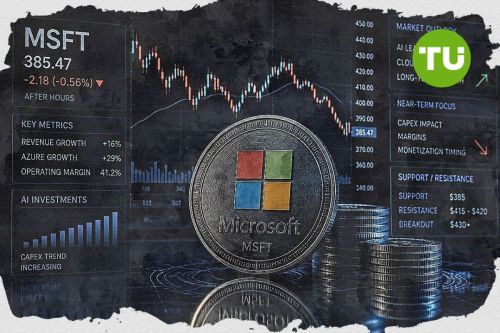
Microsoft Corporation (MSFT) is trading sharply below its MA-20 ($435.30), MA-50 ($462.72), and MA-200 ($487.34), signaling sustained downward pressure across all timeframes. The current price remains well beneath the Ichimoku Kijun level ($441.01), with no support from major moving averages in the immediate vicinity.
Highlights
- Microsoft faces elevated geopolitical and regulatory risks, especially from international sanctions related to Russia’s invasion of Ukraine, potentially affecting operations and market access.
- Ongoing U.S.-China trade tensions and scrutiny of government trading activities increase risks to Microsoft’s supply chains, cloud business, and future expansion.
- Microsoft shares are trading below all major moving averages, with expected range $395–$410 over five days and momentum indicators signaling a strong short-term bearish bias.
Expansion risks heighten as sanctions and trade tensions disrupt operations
Microsoft faces increased geopolitical and regulatory risks related to its global operations, particularly in the context of international sanctions and ongoing conflicts. Current enforcement of international sanctions measures, especially those enacted in response to Russia's invasion of Ukraine, may impact Microsoft's business segments in affected regions and restrict access to certain markets or partners. Ongoing U.S.-China trade tensions, including recent discussions over tariffs and cross-border technology dependencies, present additional threats to Microsoft's supply chains, international cloud business, and future expansion plans. Elevated scrutiny of government and Congressional trading activities, as well as calls for greater transparency in tech sector dealings, raise the risk of further regulatory intervention or legislative action targeting large technology companies like Microsoft.
Bearish signals intensify despite oversold conditions and muted volatility
Momentum remains negative, with both the MACD and ADX on the daily chart signaling a strengthening bearish trend. The RSI and Commodity Channel Index both point to oversold conditions, while the Bull/Bear Power indicator is firmly negative, reflecting continued control by sellers. The Stochastic RSI is neutral, and the Awesome Oscillator does not provide strong support for the trend. The current price is near the midpoint of today's range ($401.61 – $404.29), indicating low intraday volatility and a sideways tone, and there is a divergence between deeply oversold oscillators and persistent selling pressure.
Limited upside potential as indicators warn of further short-term weakness
Over the next five trading days, the expected price range is $395 to $410, reflecting the typical volatility band relative to current levels. With no 'Buy' signals from main weekly momentum indicators such as RSI, ADX, MACD, and MA-50, the probability of a price increase remains very low — under 20% — and downside movement is much more likely in the short term. The baseline scenario assumes price action remains range-bound between $395 and $410. A move above the Ichimoku Kijun ($441.01) would signal potential for upside, while a break below $395 would likely trigger further declines as major signals remain negative.
Previously it was reported that Microsoft shares are under persistent downward pressure, trading substantially below key moving averages with strong bearish momentum confirmed by oversold oscillators and negative MACD signals. The absence of meaningful technical support above the current level and dynamic resistance near $441 suggest a high probability of continued weakness within the established volatility range.


Latest Microsoft News


-
 Afghanistan
-
 Albania
-
 Algeria
-
 Angola
-
 Argentina
-
 Armenia
-
 Australia
-
 Austria
-
 Azerbaijan
-
 Bahamas
-
 Bahrain
-
 Bangladesh
-
 Belarus
-
 Belgium
-
 Bolivia
-
 Botswana
-
 Brazil
-
 Brunei
-
 Bulgaria
-
 Cambodia
-
 Cameroon
-
 Canada
-
 Chile
Chile
-
 China
China
-
 Colombia
-
 Congo
Congo
-
 Costa Rica
-
 Cote d'Ivoire
-
 Croatia
-
 Cuba
Cuba
-
 Cyprus
-
 Czechia
-
 DR Congo
-
 Denmark
-
 Dominican Republic
-
 Ecuador
-
 Egypt
Egypt
-
 El Salvador
-
 Estonia
-
 Eswatini
-
 Ethiopia
-
 Finland
-
 France
-
 Georgia
-
 Germany
-
 Ghana
Ghana
-
 Greece
-
 Haiti
Haiti
-
 Hong Kong
-
 Hungary
-
 India
India
-
 Indonesia
-
 Iran, Islamic republic
-
 Iraq
Iraq
-
 Ireland
-
 Israel
-
 Italy
Italy
-
 Jamaica
-
 Japan
Japan
-
 Jordan
-
 Kazakhstan
-
 Kenya
Kenya
-
 Korea
Korea
-
 Kuwait
-
 Kyrgyzstan
-
 Laos
Laos
-
 Latvia
-
 Lebanon
-
 Lesotho
-
 Libya
Libya
-
 Lithuania
-
 Luxembourg
-
 Madagascar
-
 Malaysia
-
 Malta
Malta
-
 Mauritius
-
 Mexico
-
 Moldova
-
 Mongolia
-
 Montenegro
-
 Morocco
-
 Mozambique
-
 Myanmar
-
 Namibia
-
 Nepal
Nepal
-
 Netherlands
-
 New Zealand
-
 Nigeria
-
 North Macedonia
-
 Norway
-
 Oman
Oman
-
 Pakistan
-
 Palestine
-
 Panama
-
 Papua New Guinea
-
 Paraguay
-
 Peru
Peru
-
 Philippines
-
 Poland
-
 Portugal
-
 Puerto Rico
-
 Qatar
Qatar
-
 Reunion
-
 Romania
-
 Rwanda
-
 Saudi Arabia
-
 Serbia
-
 Singapore
-
 Slovakia
-
 Slovenia
-
 Somalia
-
 South Africa
-
 Spain
Spain
-
 Sri Lanka
-
 Sweden
-
 Switzerland
-
 Syria
Syria
-
 Taiwan
-
 Tajikistan
-
 Tanzania
-
 Thailand
-
 Trinidad and Tobago
-
 Tunisia
-
 Turkey
-
 UAE
UAE
-
 Uganda
-
 Ukraine
-
 United Kingdom
-
United States
-
 Uruguay
-
 Uzbekistan
-
 Venezuela
-
 Vietnam
-
 Yemen
Yemen
-
 Zambia
-
 Zimbabwe
- Forex
- Crypto
