
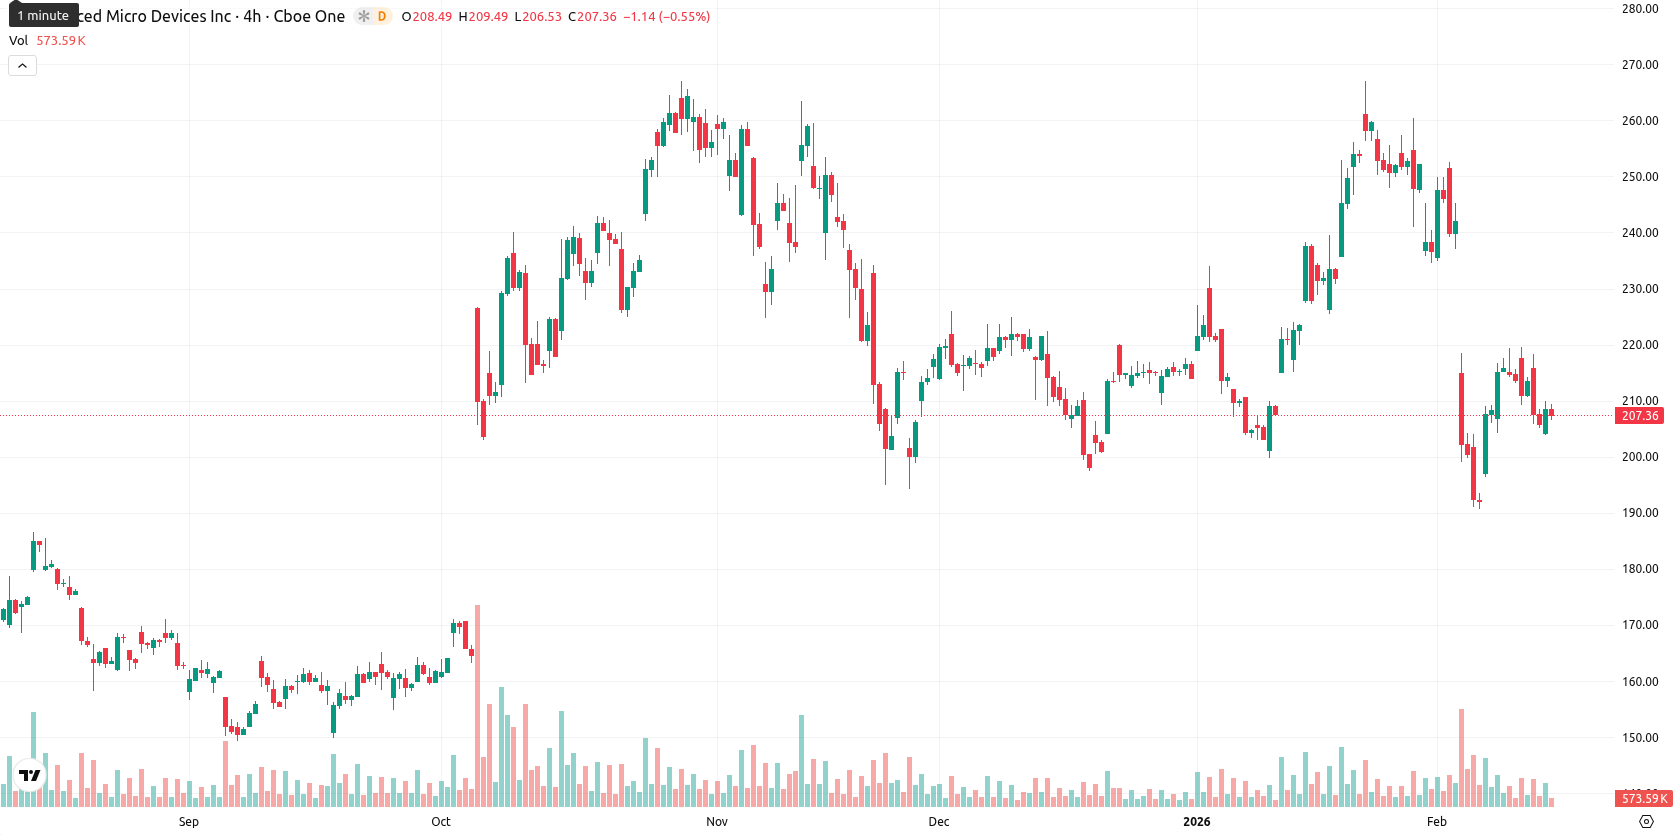
AMD steadies just above robust $200 support, faces upside barrier at $215 amid sideways forecast – weekly report

Advanced Micro Devices (AMD) is currently trading at $207.32, showing a weekly decline with the price now below its W1 MA-20 at $230.89 and MA-50 at $221.14 but remaining above the MA-200 at $181.94. This position signals persistent short- and medium-term selling pressure, while the long-term trend stays supported.
Highlights
- AMD trades at $207.32, below its MA-20 ($230.89) and MA-50 ($221.14) but above the MA-200 ($181.94), indicating short-term weakness with longer-term support.
- Technical momentum signals are mixed, with the daily MACD negative and oversold oscillators suggesting seller dominance, despite a modest intraday gain of 0.67%.
- Expected trading range for the next five days is $200–$215, with a 50% probability of either direction and a baseline scenario of sideways consolidation.
Limited upside as technical resistance persists and momentum weakens
On the weekly chart, AMD continues to encounter resistance at the Ichimoku Kijun line of $228.81 and finds support near the MA-200 at $181.94. Weekly support is robust just above $200, with resistance likely at $215 and $228.81. Weekly RSI at 41.79 underscores a cautious sentiment, as oscillators including CCI and Bull/Bear Power remain in oversold territory, and momentum indicators such as the MACD and ADX confirm a lack of strong directional impetus.
Sideways consolidation expected as breakout risk remains balanced
Looking ahead, AMD is likely to consolidate sideways over the next 5–7 trading days, with the forecasted price range between $200 and $215. Technical signals suggest only a modest 50% probability of a rebound, with equal risk for a move below key support. A push above $215 could spark a short-term rally, while failure to hold $200 may trigger further declines. The broader medium-term outlook remains neutral to mildly cautious, pending a decisive break of support or resistance.
Last time, analysts noted that Advanced Micro Devices, Inc. is trading below its short- and medium-term moving averages but remains above long-term support, signaling ongoing technical weakness despite some buyer activity near session highs. Momentum indicators are mixed and largely bearish, with oversold readings suggesting consolidation within a defined range, and key resistance and support levels identified at $228.80 and $202.50, respectively.


Latest AMD News


-
 Afghanistan
-
 Albania
-
 Algeria
-
 Angola
-
 Argentina
-
 Armenia
-
 Australia
-
 Austria
-
 Azerbaijan
-
 Bahamas
-
 Bahrain
-
 Bangladesh
-
 Belarus
-
 Belgium
-
 Bolivia
-
 Botswana
-
 Brazil
-
 Brunei
-
 Bulgaria
-
 Cambodia
-
 Cameroon
-
 Canada
-
 Chile
Chile
-
 China
China
-
 Colombia
-
 Congo
Congo
-
 Costa Rica
-
 Cote d'Ivoire
-
 Croatia
-
 Cuba
Cuba
-
 Cyprus
-
 Czechia
-
 DR Congo
-
 Denmark
-
 Dominican Republic
-
 Ecuador
-
 Egypt
Egypt
-
 El Salvador
-
 Estonia
-
 Eswatini
-
 Ethiopia
-
 Finland
-
 France
-
 Georgia
-
 Germany
-
 Ghana
Ghana
-
 Greece
-
 Haiti
Haiti
-
 Hong Kong
-
 Hungary
-
 India
India
-
 Indonesia
-
 Iran, Islamic republic
-
 Iraq
Iraq
-
 Ireland
-
 Israel
-
 Italy
Italy
-
 Jamaica
-
 Japan
Japan
-
 Jordan
-
 Kazakhstan
-
 Kenya
Kenya
-
 Korea
Korea
-
 Kuwait
-
 Kyrgyzstan
-
 Laos
Laos
-
 Latvia
-
 Lebanon
-
 Lesotho
-
 Libya
Libya
-
 Lithuania
-
 Luxembourg
-
 Madagascar
-
 Malaysia
-
 Malta
Malta
-
 Mauritius
-
 Mexico
-
 Moldova
-
 Mongolia
-
 Montenegro
-
 Morocco
-
 Mozambique
-
 Myanmar
-
 Namibia
-
 Nepal
Nepal
-
 Netherlands
-
 New Zealand
-
 Nigeria
-
 North Macedonia
-
 Norway
-
 Oman
Oman
-
 Pakistan
-
 Palestine
-
 Panama
-
 Papua New Guinea
-
 Paraguay
-
 Peru
Peru
-
 Philippines
-
 Poland
-
 Portugal
-
 Puerto Rico
-
 Qatar
Qatar
-
 Reunion
-
 Romania
-
 Rwanda
-
 Saudi Arabia
-
 Serbia
-
 Singapore
-
 Slovakia
-
 Slovenia
-
 Somalia
-
 South Africa
-
 Spain
Spain
-
 Sri Lanka
-
 Sweden
-
 Switzerland
-
 Syria
Syria
-
 Taiwan
-
 Tajikistan
-
 Tanzania
-
 Thailand
-
 Trinidad and Tobago
-
 Tunisia
-
 Turkey
-
 UAE
UAE
-
 Uganda
-
 Ukraine
-
 United Kingdom
-
United States
-
 Uruguay
-
 Uzbekistan
-
 Venezuela
-
 Vietnam
-
 Yemen
Yemen
-
 Zambia
-
 Zimbabwe
- Forex
- Crypto
