
INTU slips sharply amid persistent selling pressure, with price action anchored below MA-20, MA-50, and MA-200 – weekly forecast

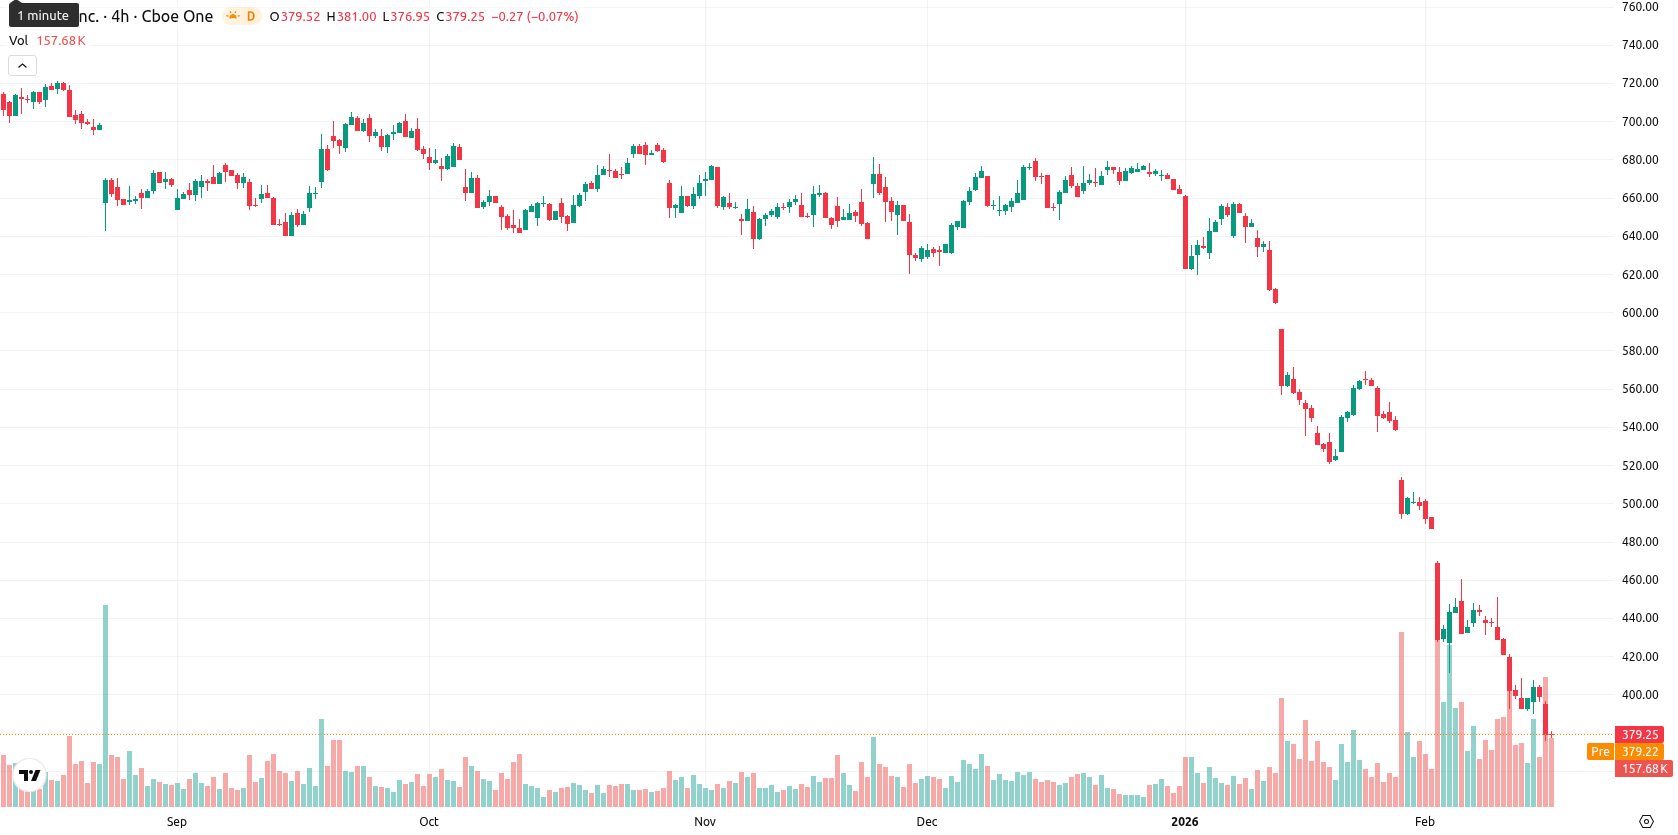
Intuit Inc. (INTU) is currently trading at $379.20, marking a sharp weekly decline of $20.14, or 5.04%. The asset remains under pronounced selling pressure, positioned significantly below its key weekly moving averages — MA-20 ($474.69), MA-50 ($579.04), and MA-200 ($670.86) — which highlights persistent weakness across all major trend horizons.
Highlights
- INTU trades at $379.20, far below its MA-20 ($474.69), MA-50 ($579.04), and MA-200 ($670.86), signaling multi-term bearish trends.
- Momentum indicators including MACD, ADX, and Awesome Oscillator are firmly bearish, with oversold conditions on RSI, Stochastic RSI, and CCI confirming strong selling momentum.
- Realistic price expectations for next week are $360–$395, with less than 20% probability of upside; key resistance is $395, support at $360.
Product launches and partnership expansion as focus shifts to upcoming earnings
Intuit strengthened its product suite by launching the Accountant Suite, an AI-enabled tool designed to streamline workflows and centralize management for accounting professionals. The company also deepened its partnership with Wix.com Ltd., integrating QuickBooks Online's AI-powered financial management tools into Wix's platform for enhanced small business operations. The upcoming quarterly earnings report is scheduled for February 26, 2026.
Persistent downside momentum as technical signals deepen bearish outlook
Weekly technical analysis signals continuing downside momentum, with INTU trading well beneath all major moving averages and below dynamic resistance marked by the Ichimoku Kijun at $513.87. No immediate Ichimoku support is present, further exposing the asset to downside risk. Momentum indicators, including MACD and ADX, both signal robust selling strength, while RSI, Stochastic RSI, and CCI all present deep oversold readings, reflecting the severity of the bearish move. Bear Power and the Awesome Oscillator remain negative, and price action shows trading near session lows following a gap down, underscoring elevated volatility and unrelenting selling pressure.
Volatile range expected as sustained oversold conditions limit recovery
For the next 5–7 trading days, INTU is expected to trade in a volatile, sideways range between $360 and $395, with the likelihood of recovery remaining low given the current indicator profile. Sustained oversold signals suggest a pause or slight retracement is possible, but further declines cannot be ruled out unless resistance near $395 is reclaimed. A break below $360 would signal renewed bearish momentum, while upside attempts are constrained by overhead resistance. Continued caution is warranted as downside risks persist through high volatility.
Previously it was reported that Intuit Inc. is trading sharply lower and remains under sustained bearish momentum, with the price well below its key moving averages and all major technical indicators such as RSI, MACD, and Stoch RSI confirming oversold conditions. The stock continues to face significant downward pressure and lacks technical support, with sellers dominating trading despite increased institutional ownership and stable core platform performance.


-
 Afghanistan
-
 Albania
-
 Algeria
-
 Angola
-
 Argentina
-
 Armenia
-
 Australia
-
 Austria
-
 Azerbaijan
-
 Bahamas
-
 Bahrain
-
 Bangladesh
-
 Belarus
-
 Belgium
-
 Bolivia
-
 Botswana
-
 Brazil
-
 Brunei
-
 Bulgaria
-
 Cambodia
-
 Cameroon
-
 Canada
-
 Chile
Chile
-
 China
China
-
 Colombia
-
 Congo
Congo
-
 Costa Rica
-
 Cote d'Ivoire
-
 Croatia
-
 Cuba
Cuba
-
 Cyprus
-
 Czechia
-
 DR Congo
-
 Denmark
-
 Dominican Republic
-
 Ecuador
-
 Egypt
Egypt
-
 El Salvador
-
 Estonia
-
 Eswatini
-
 Ethiopia
-
 Finland
-
 France
-
 Georgia
-
 Germany
-
 Ghana
Ghana
-
 Greece
-
 Haiti
Haiti
-
 Hong Kong
-
 Hungary
-
 India
India
-
 Indonesia
-
 Iran, Islamic republic
-
 Iraq
Iraq
-
 Ireland
-
 Israel
-
 Italy
Italy
-
 Jamaica
-
 Japan
Japan
-
 Jordan
-
 Kazakhstan
-
 Kenya
Kenya
-
 Korea
Korea
-
 Kuwait
-
 Kyrgyzstan
-
 Laos
Laos
-
 Latvia
-
 Lebanon
-
 Lesotho
-
 Libya
Libya
-
 Lithuania
-
 Luxembourg
-
 Madagascar
-
 Malaysia
-
 Malta
Malta
-
 Mauritius
-
 Mexico
-
 Moldova
-
 Mongolia
-
 Montenegro
-
 Morocco
-
 Mozambique
-
 Myanmar
-
 Namibia
-
 Nepal
Nepal
-
 Netherlands
-
 New Zealand
-
 Nigeria
-
 North Macedonia
-
 Norway
-
 Oman
Oman
-
 Pakistan
-
 Palestine
-
 Panama
-
 Papua New Guinea
-
 Paraguay
-
 Peru
Peru
-
 Philippines
-
 Poland
-
 Portugal
-
 Puerto Rico
-
 Qatar
Qatar
-
 Reunion
-
 Romania
-
 Rwanda
-
 Saudi Arabia
-
 Serbia
-
 Singapore
-
 Slovakia
-
 Slovenia
-
 Somalia
-
 South Africa
-
 Spain
Spain
-
 Sri Lanka
-
 Sweden
-
 Switzerland
-
 Syria
Syria
-
 Taiwan
-
 Tajikistan
-
 Tanzania
-
 Thailand
-
 Trinidad and Tobago
-
 Tunisia
-
 Turkey
-
 UAE
UAE
-
 Uganda
-
 Ukraine
-
 United Kingdom
-
United States
-
 Uruguay
-
 Uzbekistan
-
 Venezuela
-
 Vietnam
-
 Yemen
Yemen
-
 Zambia
-
 Zimbabwe
- Forex
- Crypto
