
AMD stock price forecast: Oversold readings persist as AMD trades down near $199

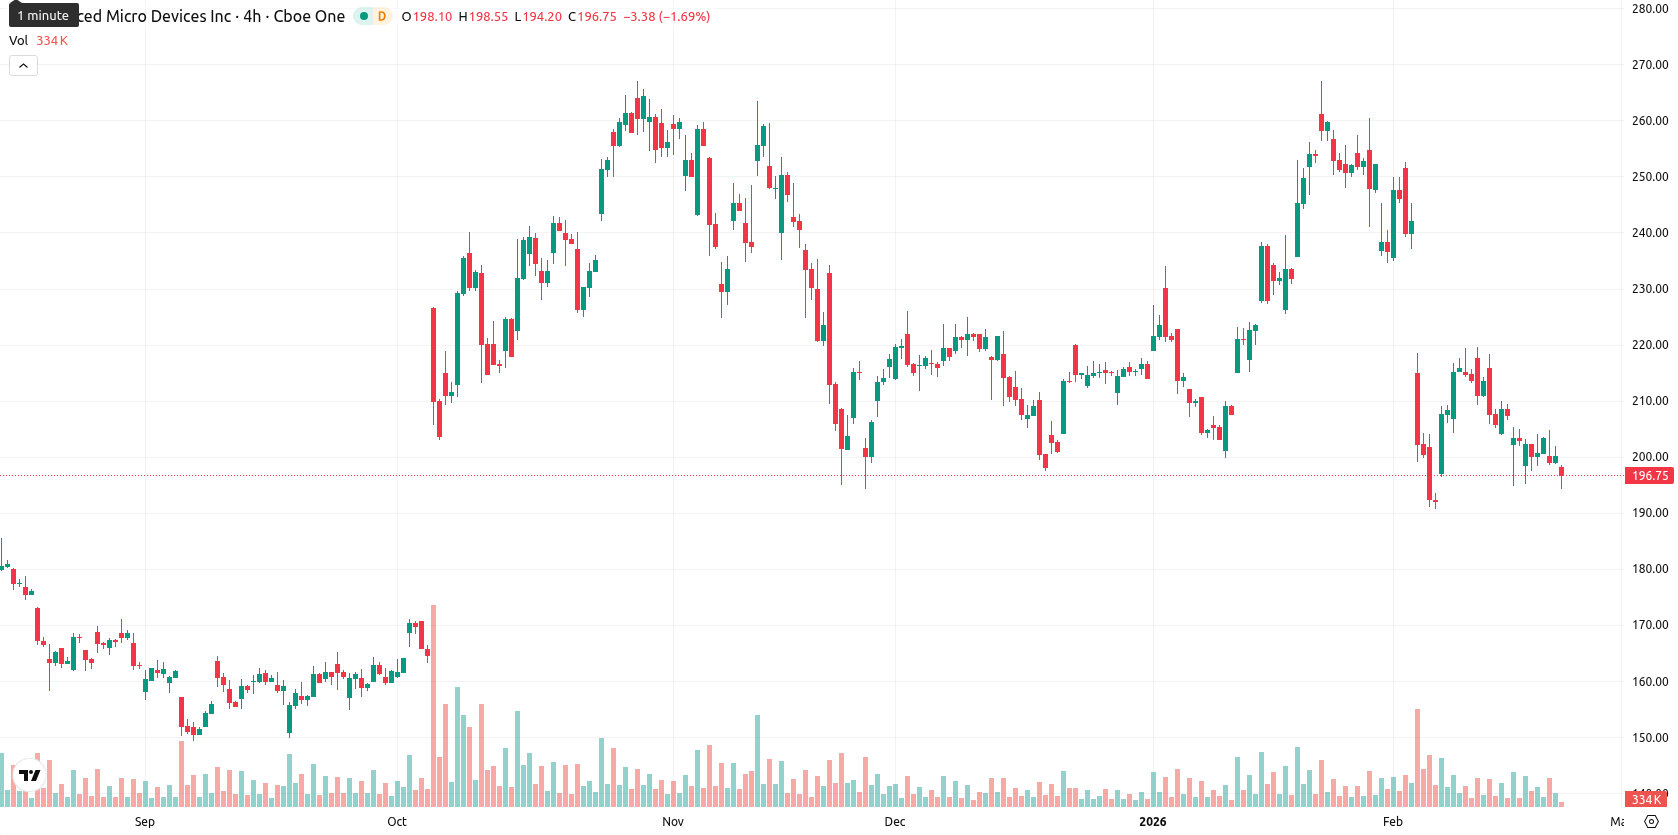
Advanced Micro Devices, Inc. (AMD) is trading at $198.81, slipping 0.62% in today's session. The asset is well below its 20-day ($222.86) and 50-day ($219.82) moving averages, signaling short- and medium-term downside pressure; however, it remains above the 200-day ($184.01) average, suggesting lingering long-term support. Immediate resistance is noted at the Ichimoku Kijun level of $228.81.
Highlights
- AMD trades at $198.81, well below its 20-day ($222.86) and 50-day ($219.82) moving averages, reflecting persistent short- and medium-term bearish pressure.
- Momentum and oscillators, including MACD, RSI (39.32), Stochastic RSI (26.10), CCI (-70.00), and Bull/Bear Power, all confirm a prevailing downside bias and seller dominance.
- Next week’s expected range is $193.00–$209.00, with immediate resistance at $228.81; a break below $193.00 would increase the risk of deeper pullbacks.
Bearish momentum persists amid oversold readings and low volatility
Momentum indicators remain bearish on the daily timeframe, with the MACD in sell territory and a low ADX value highlighting limited trend strength. Oversold conditions are present as signaled by the RSI (39.32), Stochastic RSI (26.10), and CCI ( - 70.00), while Bull/Bear Power demonstrates pronounced seller dominance. The Awesome Oscillator reinforces this downside bias as AMD trades near the top of a tight $197.04 – $198.28 session range, with intraday volatility low and a market tone characterized by sideways consolidation, despite both momentum and oscillators confirming continued selling pressure.
Downside bias strengthens as rebound odds fall with technical signals
Looking ahead to next week, typical volatility suggests AMD may trade within a $193.00 – $209.00 band relative to current levels. The probability of a short-term rebound is quite low (less than 20%), so further downside movement remains more likely. In the baseline scenario, price action is expected to move sideways within this corridor. A break above $228.81 would trigger renewed upside momentum, while a drop below $193.00 would increase the risk of deeper pullbacks, as technical indicators continue to favor sellers in the short run.
Previously it was reported that Advanced Micro Devices closed the week under persistent bearish pressure, trading below its key short- and medium-term moving averages while maintaining support above the longer-term MA-200. Technical indicators such as oversold RSI, negative MACD, and dominant seller signals underscore ongoing downside risk and weak momentum, with resistance capped near the Ichimoku Kijun and critical support at the MA-200.


Latest AMD News


-
 Afghanistan
-
 Albania
-
 Algeria
-
 Angola
-
 Argentina
-
 Armenia
-
 Australia
-
 Austria
-
 Azerbaijan
-
 Bahamas
-
 Bahrain
-
 Bangladesh
-
 Belarus
-
 Belgium
-
 Bolivia
-
 Botswana
-
 Brazil
-
 Brunei
-
 Bulgaria
-
 Cambodia
-
 Cameroon
-
 Canada
-
 Chile
Chile
-
 China
China
-
 Colombia
-
 Congo
Congo
-
 Costa Rica
-
 Cote d'Ivoire
-
 Croatia
-
 Cuba
Cuba
-
 Cyprus
-
 Czechia
-
 DR Congo
-
 Denmark
-
 Dominican Republic
-
 Ecuador
-
 Egypt
Egypt
-
 El Salvador
-
 Estonia
-
 Eswatini
-
 Ethiopia
-
 Finland
-
 France
-
 Georgia
-
 Germany
-
 Ghana
Ghana
-
 Greece
-
 Haiti
Haiti
-
 Hong Kong
-
 Hungary
-
 India
India
-
 Indonesia
-
 Iran, Islamic republic
-
 Iraq
Iraq
-
 Ireland
-
 Israel
-
 Italy
Italy
-
 Jamaica
-
 Japan
Japan
-
 Jordan
-
 Kazakhstan
-
 Kenya
Kenya
-
 Korea
Korea
-
 Kuwait
-
 Kyrgyzstan
-
 Laos
Laos
-
 Latvia
-
 Lebanon
-
 Lesotho
-
 Libya
Libya
-
 Lithuania
-
 Luxembourg
-
 Madagascar
-
 Malaysia
-
 Malta
Malta
-
 Mauritius
-
 Mexico
-
 Moldova
-
 Mongolia
-
 Montenegro
-
 Morocco
-
 Mozambique
-
 Myanmar
-
 Namibia
-
 Nepal
Nepal
-
 Netherlands
-
 New Zealand
-
 Nigeria
-
 North Macedonia
-
 Norway
-
 Oman
Oman
-
 Pakistan
-
 Palestine
-
 Panama
-
 Papua New Guinea
-
 Paraguay
-
 Peru
Peru
-
 Philippines
-
 Poland
-
 Portugal
-
 Puerto Rico
-
 Qatar
Qatar
-
 Reunion
-
 Romania
-
 Rwanda
-
 Saudi Arabia
-
 Serbia
-
 Singapore
-
 Slovakia
-
 Slovenia
-
 Somalia
-
 South Africa
-
 Spain
Spain
-
 Sri Lanka
-
 Sweden
-
 Switzerland
-
 Syria
Syria
-
 Taiwan
-
 Tajikistan
-
 Tanzania
-
 Thailand
-
 Trinidad and Tobago
-
 Tunisia
-
 Turkey
-
 UAE
UAE
-
 Uganda
-
 Ukraine
-
 United Kingdom
-
United States
-
 Uruguay
-
 Uzbekistan
-
 Venezuela
-
 Vietnam
-
 Yemen
Yemen
-
 Zambia
-
 Zimbabwe
- Forex
- Crypto
