
AMD stock: Meta collaboration and AI growth drive a 6.80% surge despite weak momentum

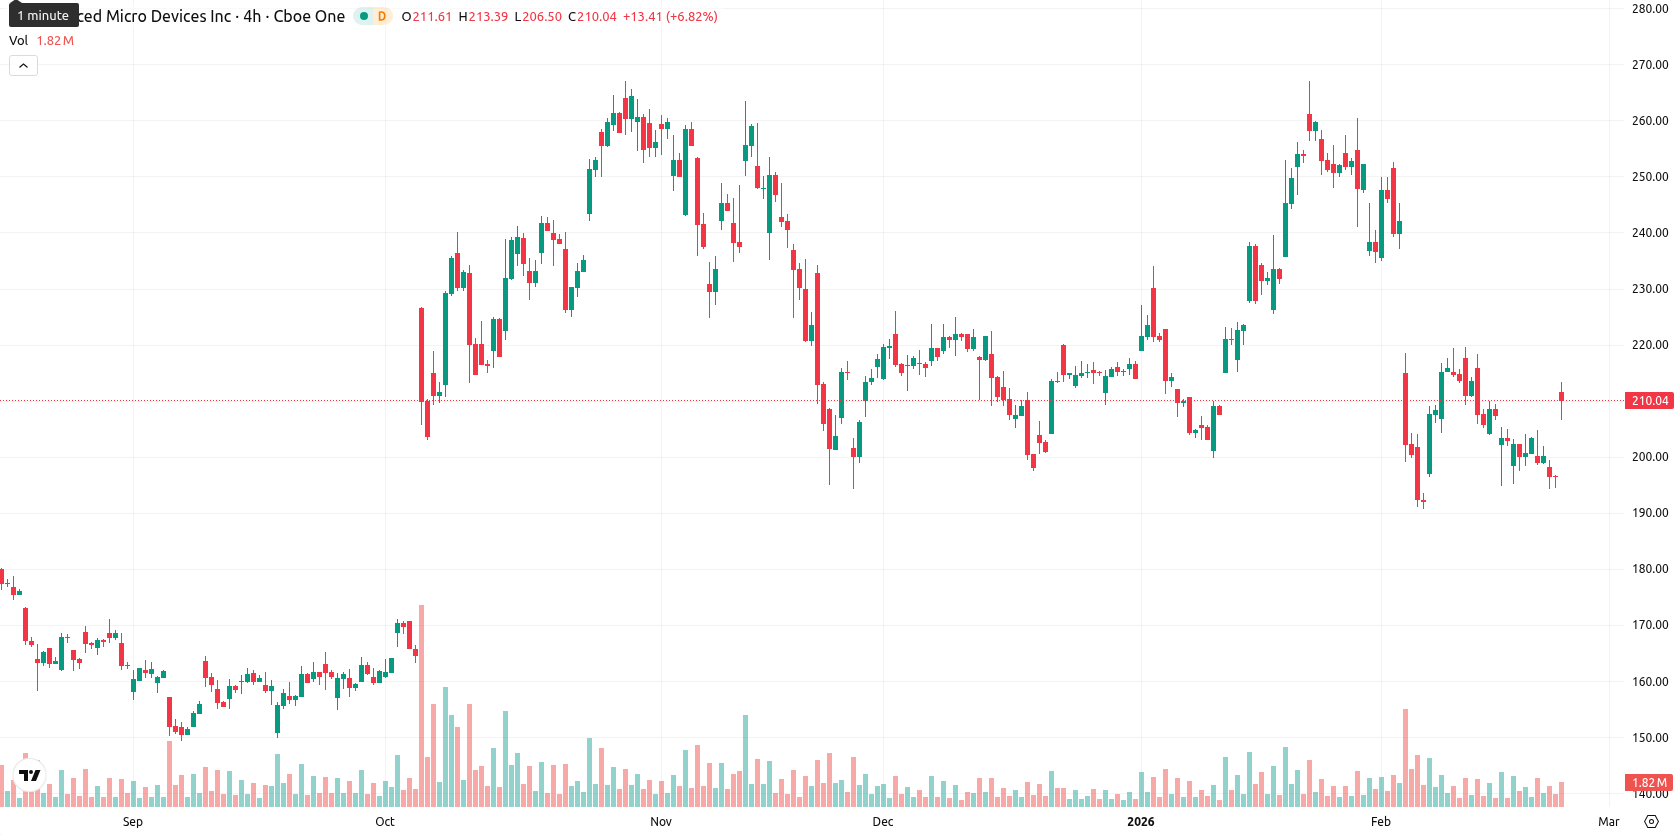
Advanced Micro Devices, Inc. (AMD) is trading at $209.97, down on the day both in absolute and percentage terms. The stock is below the MA-20 ($219.70) and MA-50 ($219.32), indicating short- and medium-term downward pressure, but it remains well above the MA-200 ($184.50), highlighting enduring longer-term support levels. The Ichimoku Kijun sits at $228.81, acting as immediate resistance.
Highlights
- AMD signed a multi-year strategic deal with Meta Platforms to supply up to 6 gigawatts of GPUs and EPYC CPUs for AI data centers.
- Meta can acquire up to 160 million AMD shares via a performance-based warrant, with initial GPU deployment slated for H2 2026 and management projecting significant, accretive multi-year revenue growth.
- Technically, AMD trades at $209.97 below MA-20 and MA-50 with immediate resistance at $228.81, and technical signals highlight weak momentum and a probable sideways range between $200 and $220.
AI partnership with Meta bolsters multi-year growth and sector positioning
AMD has entered a multi-year strategic partnership with Meta Platforms to supply up to 6 gigawatts of AMD GPUs and EPYC CPUs for Meta's AI data centers. The agreement allows Meta to acquire up to 160 million AMD shares through a performance-based warrant, and the first gigawatt of GPU deployment is expected in the second half of 2026. Company management indicated that the deal will drive significant multi-year revenue growth and be accretive to adjusted earnings per share, further enhancing AMD's position in the AI infrastructure space.
Persistent bearish signals amid strong session volatility and weak momentum
Short-term momentum for AMD remains weak, as the MACD signals a sell and the ADX on the daily chart points to a lack of trend strength. Indicators such as RSI (37.66), Stochastic RSI (22.51), and CCI (-79.57) underscore a continued oversold and bearish environment, while Bull/Bear Power confirms seller dominance on the intraday timeframe. Today’s session opened with a sharp gap up and, after an upward move of 6.80%, the price sits near the session’s midpoint, reflecting high volatility and ongoing consolidation. There is a notable divergence between the strong daily move and persistent weak momentum signals.
Rangebound outlook as upside risks remain subdued near key resistance
For the coming week, AMD is expected to trade in a range between $200 and $220, in line with its typical volatility band relative to current levels. The probability of further price increases remains low (less than 20%), while a pullback or sideways drift appears more likely. In the base case, AMD stays in a consolidation corridor between $200 and $220; a bullish breakout would require a sustained close above the $228.81 resistance level, while a bearish scenario would bring prices back toward longer-term support near $200.
Previously it was reported that Advanced Micro Devices Inc traded below its short- and medium-term moving averages, indicating ongoing bearish pressure, while maintaining support well above the longer-term 200-day average. Despite strong intraday price gains and high volatility, key momentum indicators such as MACD, RSI, and oscillators continue to signal weak or oversold conditions, suggesting the recent rally may lack broad technical confirmation and faces resistance near the Ichimoku Kijun level.


Latest AMD News


-
 Afghanistan
-
 Albania
-
 Algeria
-
 Angola
-
 Argentina
-
 Armenia
-
 Australia
-
 Austria
-
 Azerbaijan
-
 Bahamas
-
 Bahrain
-
 Bangladesh
-
 Belarus
-
 Belgium
-
 Bolivia
-
 Botswana
-
 Brazil
-
 Brunei
-
 Bulgaria
-
 Cambodia
-
 Cameroon
-
 Canada
-
 Chile
Chile
-
 China
China
-
 Colombia
-
 Congo
Congo
-
 Costa Rica
-
 Cote d'Ivoire
-
 Croatia
-
 Cuba
Cuba
-
 Cyprus
-
 Czechia
-
 DR Congo
-
 Denmark
-
 Dominican Republic
-
 Ecuador
-
 Egypt
Egypt
-
 El Salvador
-
 Estonia
-
 Eswatini
-
 Ethiopia
-
 Finland
-
 France
-
 Georgia
-
 Germany
-
 Ghana
Ghana
-
 Greece
-
 Haiti
Haiti
-
 Hong Kong
-
 Hungary
-
 India
India
-
 Indonesia
-
 Iran, Islamic republic
-
 Iraq
Iraq
-
 Ireland
-
 Israel
-
 Italy
Italy
-
 Jamaica
-
 Japan
Japan
-
 Jordan
-
 Kazakhstan
-
 Kenya
Kenya
-
 Korea
Korea
-
 Kuwait
-
 Kyrgyzstan
-
 Laos
Laos
-
 Latvia
-
 Lebanon
-
 Lesotho
-
 Libya
Libya
-
 Lithuania
-
 Luxembourg
-
 Madagascar
-
 Malaysia
-
 Malta
Malta
-
 Mauritius
-
 Mexico
-
 Moldova
-
 Mongolia
-
 Montenegro
-
 Morocco
-
 Mozambique
-
 Myanmar
-
 Namibia
-
 Nepal
Nepal
-
 Netherlands
-
 New Zealand
-
 Nigeria
-
 North Macedonia
-
 Norway
-
 Oman
Oman
-
 Pakistan
-
 Palestine
-
 Panama
-
 Papua New Guinea
-
 Paraguay
-
 Peru
Peru
-
 Philippines
-
 Poland
-
 Portugal
-
 Puerto Rico
-
 Qatar
Qatar
-
 Reunion
-
 Romania
-
 Rwanda
-
 Saudi Arabia
-
 Serbia
-
 Singapore
-
 Slovakia
-
 Slovenia
-
 Somalia
-
 South Africa
-
 Spain
Spain
-
 Sri Lanka
-
 Sweden
-
 Switzerland
-
 Syria
Syria
-
 Taiwan
-
 Tajikistan
-
 Tanzania
-
 Thailand
-
 Trinidad and Tobago
-
 Tunisia
-
 Turkey
-
 UAE
UAE
-
 Uganda
-
 Ukraine
-
 United Kingdom
-
United States
-
 Uruguay
-
 Uzbekistan
-
 Venezuela
-
 Vietnam
-
 Yemen
Yemen
-
 Zambia
-
 Zimbabwe
- Forex
- Crypto
