
-4.51% for Hut 8 stock — Technicals signal short-term weakness despite long-term trend

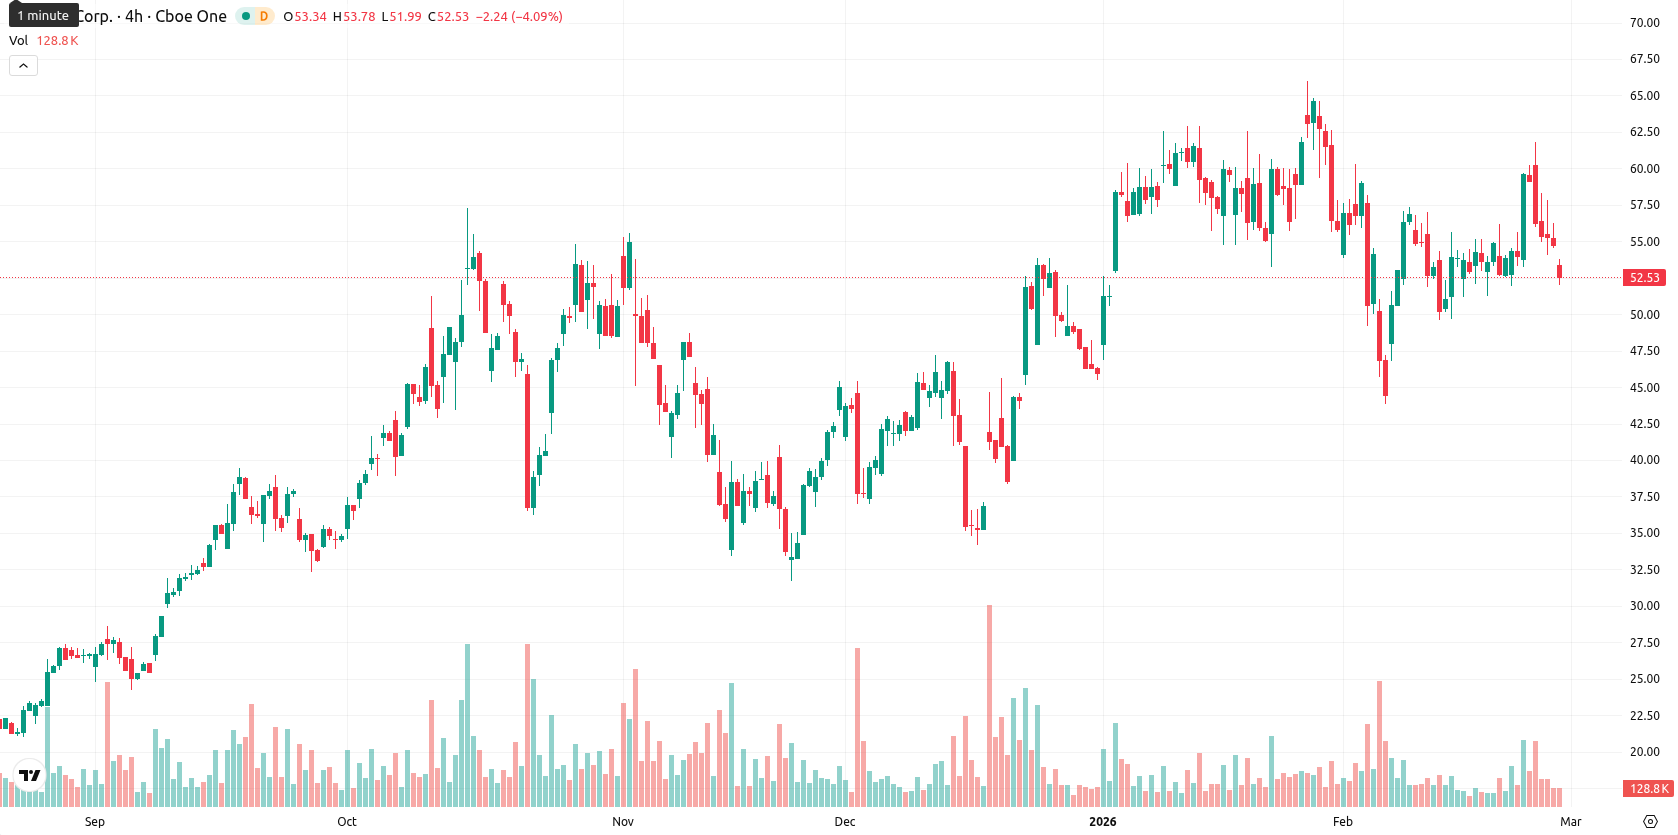
Hut 8 Corp (HUT) is trading at $52.35, marking a daily decline of 4.51%. The stock is positioned below the MA-20 ($54.64) and MA-50 ($53.78) but remains well above the MA-200 ($35.86), suggesting continued short- and medium-term selling pressure despite a bullish long-term trend. The Ichimoku Kijun level at $54.94 serves as immediate resistance.
Highlights
- Hut 8 reported a Q4 net loss of $280.2 million and full-year 2025 revenue of $235.1 million as it pivoted toward AI infrastructure.
- A 15-year, 245 MW IT lease at the River Bend campus with Fluidstack and a partnership with Anthropic secured $7.0 billion in contracted revenue.
- HUT trades at $52.35 below short-term MAs ($54.64 MA-20, $53.78 MA-50) with $54.94 as immediate resistance and $51.00 as key support.
AI infrastructure shift and major deals shape sentiment under selling pressure
Hut 8 released its Q4 and full-year 2025 results, reporting a Q4 net loss of $280.2 million from continuing operations and revenue of $88.5 million for the quarter. For the full year, the company recorded $235.1 million in revenue, with compute operations revenue more than doubling to $202.3 million as Hut 8 shifted its focus to AI infrastructure. The period saw the signing of a 15-year, 245 MW IT lease at the River Bend campus with Fluidstack, amounting to $7.0 billion in contracted revenue, alongside a new strategic partnership with Anthropic. Additional developments included securing a $400 million revolving credit facility, launching a $1 billion ATM program, and initiating work on infrastructure upgrades for the planned Louisiana data center, though price action has remained under broader selling pressure.
Mixed momentum and resistance obstacles highlight fragile near-term setup
Technical analysis indicates HUT is trading underneath its MA-20 and MA-50, but remains well above the MA-200, emphasizing ongoing near-term weakness with a strong long-term structure intact. The Ichimoku Kijun at $54.94 acts as a nearby resistance point. Momentum indicators including MACD and ADX are neutral, while the RSI stands close to 50 with neither clear overbought nor oversold conditions confirmed by the Stochastic RSI and CCI. Bull/Bear Power shows overbought status on the daily chart but seller control intraday, and the Awesome Oscillator is neutral, producing mixed technical signals.
Sideways trade likely as volatility bands contain downside risk
For the coming week, HUT is expected to trade within a volatility band of $51.00 to $55.00. There is a high probability (over 80%) of sideways movement with limited downside risk. Should HUT break above the immediate resistance at $54.94, a move toward $55.00 could follow. Conversely, a decline below the $51.00 support may trigger a deeper correction, despite the prevailing long-term bullish signals.
Previously it was reported that Hut 8 Corp trades below its short- and medium-term moving averages but remains well above long-term support, with momentum indicators largely neutral and the RSI near 50, reflecting indecisive sentiment following a 4% decline. Despite rising revenue and strong liquidity, diverging technical signals and price action closing near session lows suggest a lack of immediate directional conviction.


-
 Afghanistan
-
 Albania
-
 Algeria
-
 Angola
-
 Argentina
-
 Armenia
-
 Australia
-
 Austria
-
 Azerbaijan
-
 Bahamas
-
 Bahrain
-
 Bangladesh
-
 Belarus
-
 Belgium
-
 Bolivia
-
 Botswana
-
 Brazil
-
 Brunei
-
 Bulgaria
-
 Cambodia
-
 Cameroon
-
 Canada
-
 Chile
Chile
-
 China
China
-
 Colombia
-
 Congo
Congo
-
 Costa Rica
-
 Cote d'Ivoire
-
 Croatia
-
 Cuba
Cuba
-
 Cyprus
-
 Czechia
-
 DR Congo
-
 Denmark
-
 Dominican Republic
-
 Ecuador
-
 Egypt
Egypt
-
 El Salvador
-
 Estonia
-
 Eswatini
-
 Ethiopia
-
 Finland
-
 France
-
 Georgia
-
 Germany
-
 Ghana
Ghana
-
 Greece
-
 Haiti
Haiti
-
 Hong Kong
-
 Hungary
-
 India
India
-
 Indonesia
-
 Iran, Islamic republic
-
 Iraq
Iraq
-
 Ireland
-
 Israel
-
 Italy
Italy
-
 Jamaica
-
 Japan
Japan
-
 Jordan
-
 Kazakhstan
-
 Kenya
Kenya
-
 Korea
Korea
-
 Kuwait
-
 Kyrgyzstan
-
 Laos
Laos
-
 Latvia
-
 Lebanon
-
 Lesotho
-
 Libya
Libya
-
 Lithuania
-
 Luxembourg
-
 Madagascar
-
 Malaysia
-
 Malta
Malta
-
 Mauritius
-
 Mexico
-
 Moldova
-
 Mongolia
-
 Montenegro
-
 Morocco
-
 Mozambique
-
 Myanmar
-
 Namibia
-
 Nepal
Nepal
-
 Netherlands
-
 New Zealand
-
 Nigeria
-
 North Macedonia
-
 Norway
-
 Oman
Oman
-
 Pakistan
-
 Palestine
-
 Panama
-
 Papua New Guinea
-
 Paraguay
-
 Peru
Peru
-
 Philippines
-
 Poland
-
 Portugal
-
 Puerto Rico
-
 Qatar
Qatar
-
 Reunion
-
 Romania
-
 Rwanda
-
 Saudi Arabia
-
 Serbia
-
 Singapore
-
 Slovakia
-
 Slovenia
-
 Somalia
-
 South Africa
-
 Spain
Spain
-
 Sri Lanka
-
 Sweden
-
 Switzerland
-
 Syria
Syria
-
 Taiwan
-
 Tajikistan
-
 Tanzania
-
 Thailand
-
 Trinidad and Tobago
-
 Tunisia
-
 Turkey
-
 UAE
UAE
-
 Uganda
-
 Ukraine
-
 United Kingdom
-
United States
-
 Uruguay
-
 Uzbekistan
-
 Venezuela
-
 Vietnam
-
 Yemen
Yemen
-
 Zambia
-
 Zimbabwe
- Forex
- Crypto
