
Sundial Growers stock: Divergent momentum indicators fuel 3.16% decline and cautious outlook

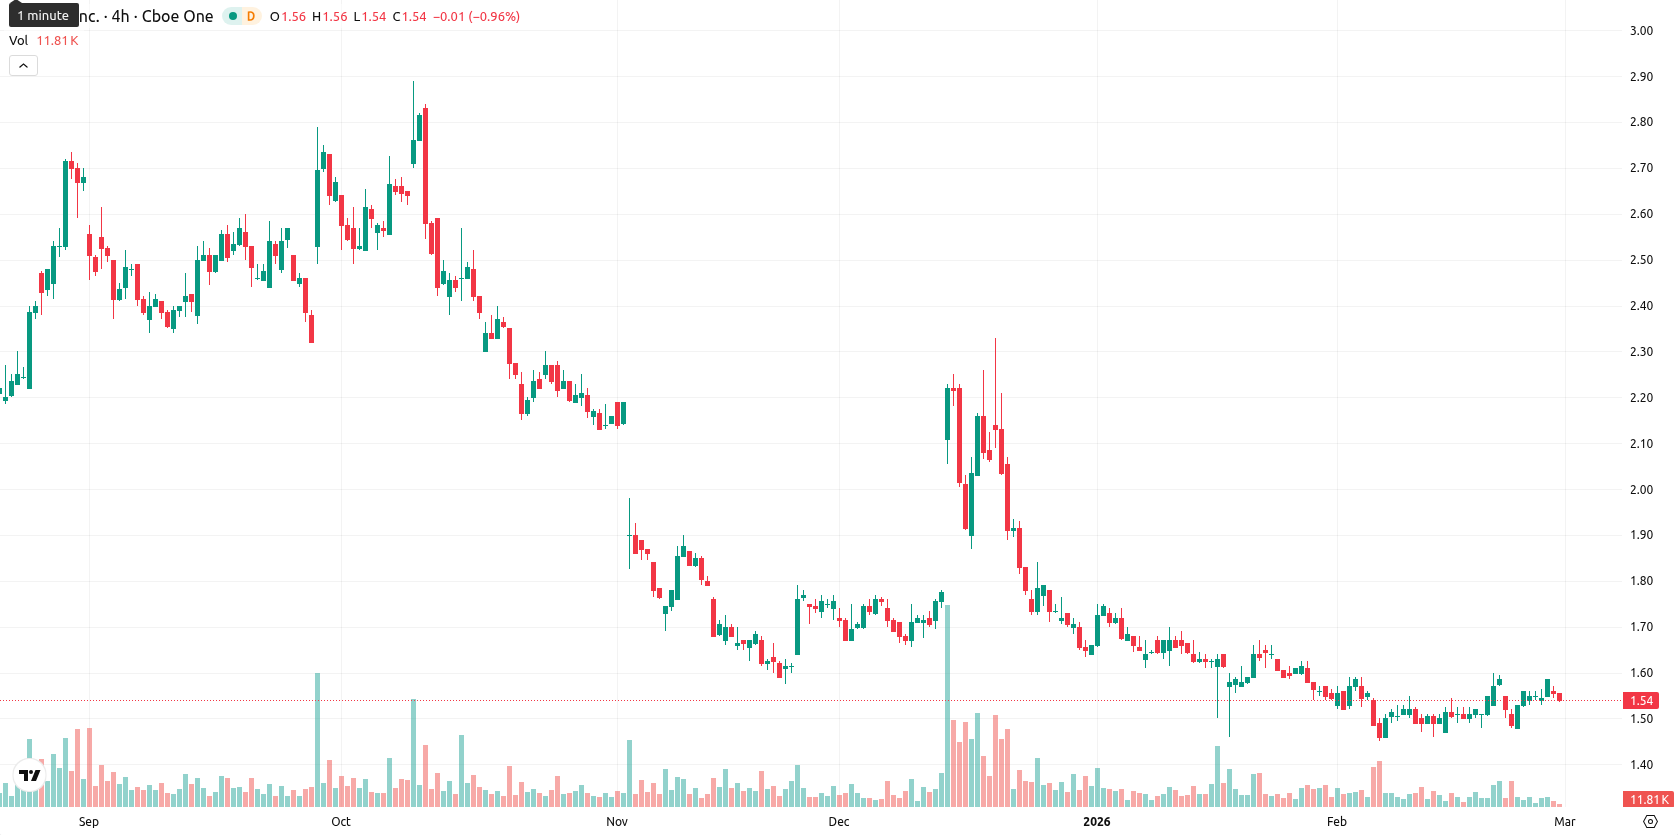
SNDL Inc. (SNDL) is trading at $1.53 after a daily decline of 3.16%. The price sits directly on the 20-day Moving Average ($1.53), well below the 50-day ($1.64) and 200-day ($1.80) averages, reflecting mixed short-term momentum and ongoing downward pressure over the medium to long term.
Highlights
- SNDL is trading at $1.53, right at the 20-day Moving Average, but well below the 50-day ($1.64) and 200-day ($1.80) averages, signaling persistent medium- and long-term downside pressure.
- Current daily momentum is bearish, with MACD showing 'Strong Sell', price down 3.16% from the previous close, and intraday volatility subdued near today's lows.
- Key levels: Ichimoku Kijun at $1.56 as immediate resistance; weekly indicators and low probability of price increase (<20%) point to a likely sideways or declining trend within the $1.48–$1.62 range.
Mixed oscillator signals fuel seller bias at key resistance
Technically, the Ichimoku Kijun level at $1.56 acts as immediate resistance above the current price. SNDL is showing subdued momentum on the daily chart, with the MACD issuing a 'Strong Sell,' a neutral ADX, and mixed oscillator signals: RSI indicates mild accumulation (buy), Stochastic RSI reads overbought, and CCI holds neutral-to-positive. Bull/Bear Power is slightly positive, favoring buyers intraday, while the Awesome Oscillator is neutral. Price action today shows a move near the session low within a narrow range and continued pressure from the open. The divergent oscillators indicate lack of consensus, but daily momentum remains tilted toward sellers.
Sideways trading likely as upside risk remains limited
For the next five trading days, the forecast range is $1.48 to $1.62, aligning with typical volatility for SNDL. The probability of a near-term price increase is low (less than 20%), as confirmed by weak weekly moving averages, RSI, and MACD readings. The base case scenario is for the price to oscillate sideways within the $1.48–$1.62 band. Should SNDL break above the $1.56 Ichimoku Kijun, there is potential to reach $1.62, while extended weakness below $1.50 risks further declines toward $1.48.
Previously it was reported that Sundial Growers Inc. is trading just above its short-term moving average, indicating mild support, but remains under medium- and long-term selling pressure with resistance near $1.56 and subdued volatility. Technical indicators are mixed, as MACD signals a strong sell while RSI, Stoch RSI, and other oscillators point to indecision, leaving near-term direction uncertain and contingent on the reaction around current support and resistance levels.


-
 Afghanistan
-
 Albania
-
 Algeria
-
 Angola
-
 Argentina
-
 Armenia
-
 Australia
-
 Austria
-
 Azerbaijan
-
 Bahamas
-
 Bahrain
-
 Bangladesh
-
 Belarus
-
 Belgium
-
 Bolivia
-
 Botswana
-
 Brazil
-
 Brunei
-
 Bulgaria
-
 Cambodia
-
 Cameroon
-
 Canada
-
 Chile
Chile
-
 China
China
-
 Colombia
-
 Congo
Congo
-
 Costa Rica
-
 Cote d'Ivoire
-
 Croatia
-
 Cuba
Cuba
-
 Cyprus
-
 Czechia
-
 DR Congo
-
 Denmark
-
 Dominican Republic
-
 Ecuador
-
 Egypt
Egypt
-
 El Salvador
-
 Estonia
-
 Eswatini
-
 Ethiopia
-
 Finland
-
 France
-
 Georgia
-
 Germany
-
 Ghana
Ghana
-
 Greece
-
 Haiti
Haiti
-
 Hong Kong
-
 Hungary
-
 India
India
-
 Indonesia
-
 Iran, Islamic republic
-
 Iraq
Iraq
-
 Ireland
-
 Israel
-
 Italy
Italy
-
 Jamaica
-
 Japan
Japan
-
 Jordan
-
 Kazakhstan
-
 Kenya
Kenya
-
 Korea
Korea
-
 Kuwait
-
 Kyrgyzstan
-
 Laos
Laos
-
 Latvia
-
 Lebanon
-
 Lesotho
-
 Libya
Libya
-
 Lithuania
-
 Luxembourg
-
 Madagascar
-
 Malaysia
-
 Malta
Malta
-
 Mauritius
-
 Mexico
-
 Moldova
-
 Mongolia
-
 Montenegro
-
 Morocco
-
 Mozambique
-
 Myanmar
-
 Namibia
-
 Nepal
Nepal
-
 Netherlands
-
 New Zealand
-
 Nigeria
-
 North Macedonia
-
 Norway
-
 Oman
Oman
-
 Pakistan
-
 Palestine
-
 Panama
-
 Papua New Guinea
-
 Paraguay
-
 Peru
Peru
-
 Philippines
-
 Poland
-
 Portugal
-
 Puerto Rico
-
 Qatar
Qatar
-
 Reunion
-
 Romania
-
 Rwanda
-
 Saudi Arabia
-
 Serbia
-
 Singapore
-
 Slovakia
-
 Slovenia
-
 Somalia
-
 South Africa
-
 Spain
Spain
-
 Sri Lanka
-
 Sweden
-
 Switzerland
-
 Syria
Syria
-
 Taiwan
-
 Tajikistan
-
 Tanzania
-
 Thailand
-
 Trinidad and Tobago
-
 Tunisia
-
 Turkey
-
 UAE
UAE
-
 Uganda
-
 Ukraine
-
 United Kingdom
-
United States
-
 Uruguay
-
 Uzbekistan
-
 Venezuela
-
 Vietnam
-
 Yemen
Yemen
-
 Zambia
-
 Zimbabwe
- Forex
- Crypto
