
Persistent bearish signals and technical resistance — NuCana stock drops 4.63%

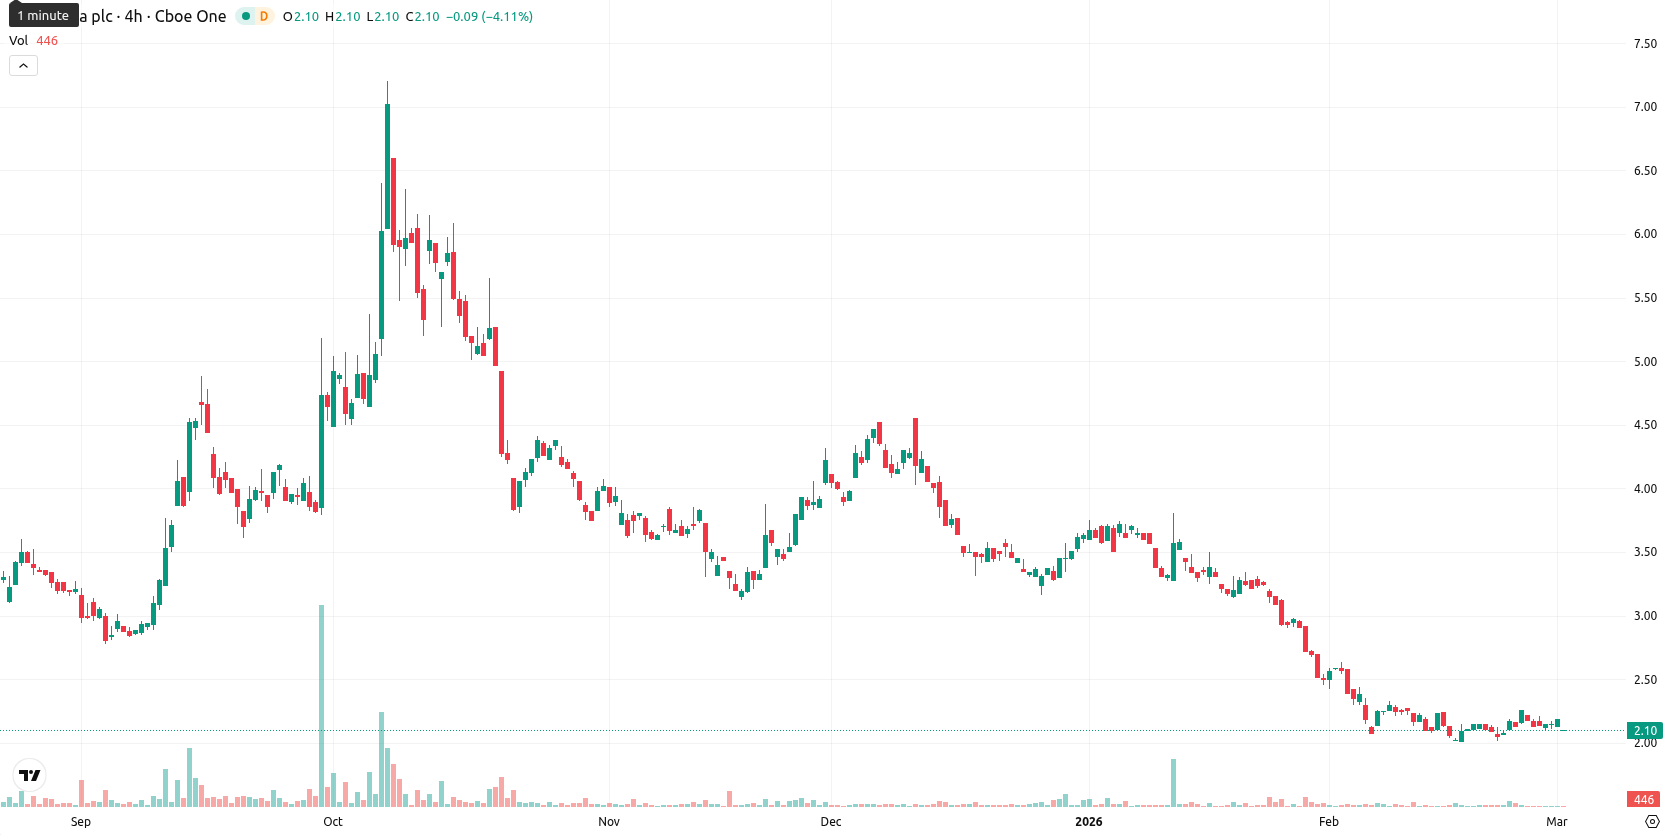
NuCana plc ADR (NCNA) is trading at $2.06, recording a daily decline of 4.63%. The price is below its MA-20 ($2.21), MA-50 ($2.91), and MA-200 ($6.29), indicating continued pressure from sellers across all observed time frames.
Highlights
- NCNA is trading at $2.06, below its MA-20 ($2.21), MA-50 ($2.91), and MA-200 ($6.29), reflecting persistent short to long-term selling pressure.
- Technical momentum remains weak, with daily MACD strongly bearish, ADX at 23.69 signaling only a modest trend, and negative Bull/Bear Power confirming seller dominance.
- Price is expected to move sideways between $1.85 and $2.18 over the next five sessions, with a breakout above $2.18 needed for any bullish reversal.
Persistent bearish momentum as sellers cap intraday recovery
All key technical indicators point to persistent bearish momentum. The Ichimoku Kijun level is at $2.68, now acting as immediate resistance. The MACD on the daily chart shows strong bearish momentum, with the ADX at 23.69 reflecting a modestly trending market under seller control. RSI stands at 36.92 and CCI at -51.67, both indicating continued selling pressure but not deeply oversold. The Stochastic RSI is overbought, signaling oscillator divergence. Bull/Bear Power remains negative, confirming seller dominance intraday. Trading opened with a $0.03 gap down and is near the lower end of today's range amid moderate volatility and ongoing downward pressure.
Lower price risk as volatility bands contain rebound potential
In the short term, NCNA is expected to trade between $1.85 and $2.18, maintaining a volatility band relative to current levels. The probability of a price increase is low (less than 20%), with further decline more likely. The baseline scenario sees sideways movement within the $1.85 – $2.18 range. A bullish reversal would need a breakout above $2.18 toward the $2.68 resistance, while a close below $1.85 would extend the current downtrend.
Last time, analysts noted that NuCana plc ADR is exhibiting sustained bearish momentum, trading below key short, medium, and long-term moving averages amid persistent selling pressure. Technical indicators, including MACD, ADX, and RSI, confirm ongoing weakness, with immediate resistance at the Ichimoku kijun and limited support nearby, signaling a continued downside bias and low rebound potential.


Latest NuCana News


-
 Afghanistan
-
 Albania
-
 Algeria
-
 Angola
-
 Argentina
-
 Armenia
-
 Australia
-
 Austria
-
 Azerbaijan
-
 Bahamas
-
 Bahrain
-
 Bangladesh
-
 Belarus
-
 Belgium
-
 Bolivia
-
 Botswana
-
 Brazil
-
 Brunei
-
 Bulgaria
-
 Cambodia
-
 Cameroon
-
 Canada
-
 Chile
Chile
-
 China
China
-
 Colombia
-
 Congo
Congo
-
 Costa Rica
-
 Cote d'Ivoire
-
 Croatia
-
 Cuba
Cuba
-
 Cyprus
-
 Czechia
-
 DR Congo
-
 Denmark
-
 Dominican Republic
-
 Ecuador
-
 Egypt
Egypt
-
 El Salvador
-
 Estonia
-
 Eswatini
-
 Ethiopia
-
 Finland
-
 France
-
 Georgia
-
 Germany
-
 Ghana
Ghana
-
 Greece
-
 Haiti
Haiti
-
 Hong Kong
-
 Hungary
-
 India
India
-
 Indonesia
-
 Iran, Islamic republic
-
 Iraq
Iraq
-
 Ireland
-
 Israel
-
 Italy
Italy
-
 Jamaica
-
 Japan
Japan
-
 Jordan
-
 Kazakhstan
-
 Kenya
Kenya
-
 Korea
Korea
-
 Kuwait
-
 Kyrgyzstan
-
 Laos
Laos
-
 Latvia
-
 Lebanon
-
 Lesotho
-
 Libya
Libya
-
 Lithuania
-
 Luxembourg
-
 Madagascar
-
 Malaysia
-
 Malta
Malta
-
 Mauritius
-
 Mexico
-
 Moldova
-
 Mongolia
-
 Montenegro
-
 Morocco
-
 Mozambique
-
 Myanmar
-
 Namibia
-
 Nepal
Nepal
-
 Netherlands
-
 New Zealand
-
 Nigeria
-
 North Macedonia
-
 Norway
-
 Oman
Oman
-
 Pakistan
-
 Palestine
-
 Panama
-
 Papua New Guinea
-
 Paraguay
-
 Peru
Peru
-
 Philippines
-
 Poland
-
 Portugal
-
 Puerto Rico
-
 Qatar
Qatar
-
 Reunion
-
 Romania
-
 Rwanda
-
 Saudi Arabia
-
 Serbia
-
 Singapore
-
 Slovakia
-
 Slovenia
-
 Somalia
-
 South Africa
-
 Spain
Spain
-
 Sri Lanka
-
 Sweden
-
 Switzerland
-
 Syria
Syria
-
 Taiwan
-
 Tajikistan
-
 Tanzania
-
 Thailand
-
 Trinidad and Tobago
-
 Tunisia
-
 Turkey
-
 UAE
UAE
-
 Uganda
-
 Ukraine
-
 United Kingdom
-
United States
-
 Uruguay
-
 Uzbekistan
-
 Venezuela
-
 Vietnam
-
 Yemen
Yemen
-
 Zambia
-
 Zimbabwe
- Forex
- Crypto
