
-3.16% for Texas Instruments stock — Mixed technicals drive volatile session

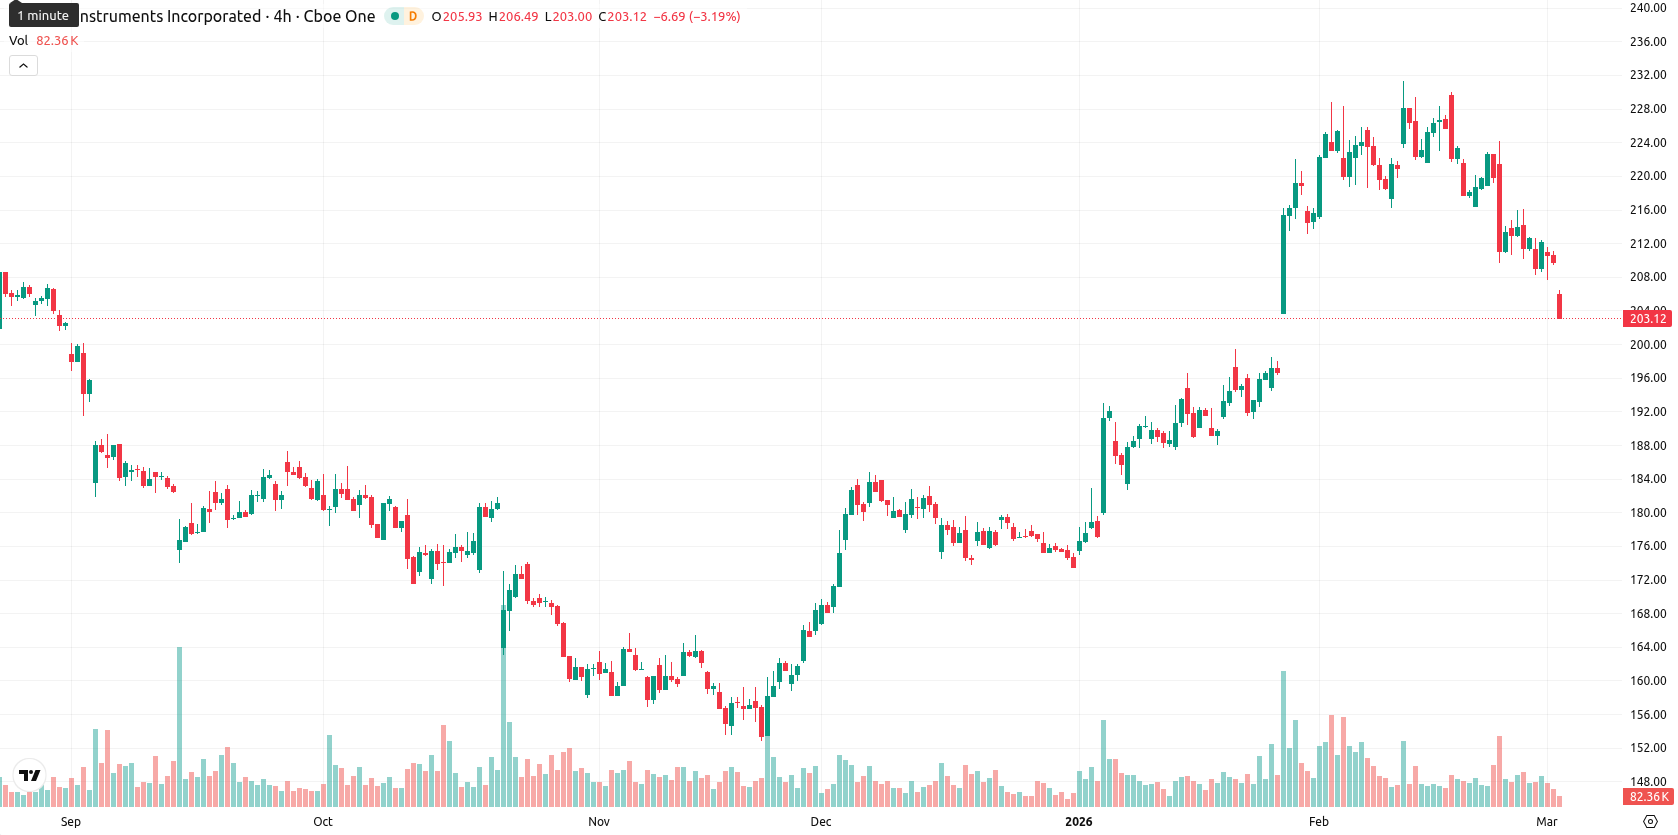
Texas Instruments Incorporated (TXN) is trading at $203.04, which is well below its MA-20 at $220.11 but just above the MA-50 at $200.86 and significantly above the MA-200 at $189.70. This positioning signals short-term selling pressure, while the medium- and long-term structure remain intact, supported by the underlying upward trend.
Highlights
- Texas Instruments closed at $203.04, below its MA-20 ($220.11) but just above its MA-50 ($200.86), indicating short-term selling pressure.
- Momentum is mixed: daily MACD remains strongly bullish, but RSI, CCI, and Stochastic RSI show oversold conditions and short-term sellers dominating.
- Key technical levels are immediate resistance at $211.22 (Kijun); a break below $200.00 could prompt further downside to $198.00 over the next week.
Intraday downside momentum diverges from underlying bullish signals
Momentum indicators are currently mixed: the MACD on D1 remains strongly bullish, while the ADX shows a robust trend. However, the RSI and Commodity Channel Index show short-term selling activity and oversold conditions, confirmed by the Stochastic RSI being fully oversold. Bull/Bear Power indicates sellers are dominating today’s action, and the Awesome Oscillator remains neutral, failing to reinforce any directional view. The Ichimoku Kijun level on D1 is $211.22, marking immediate resistance for the price. The stock dropped 3.16% with no significant gap between the prior close and today’s open, and the price has settled near the lower end of today’s range, reflecting high intraday volatility and continued downside pressure after the open. These developments show a divergence between persistent negative intraday momentum and longer-term momentum indicators holding a bullish bias.
Sideways consolidation expected amid balanced risk scenarios
For the next five trading days, the expected price range is adjusted to $198.00 – $210.00 to reflect typical volatility and the current market level. The probability of a price increase is average, while the chance of a further decline is also moderate based on the balance of weekly technical signals. The baseline scenario is for the price to consolidate sideways within this corridor. A bullish scenario would see a breakout above $211.22, opening the way toward the $210.00 area and possibly higher if momentum improves. Conversely, a bearish scenario would be triggered if the price breaks below $200.00, potentially testing the lower end near $198.00.
Previously it was reported that Texas Instruments is trading below its 20-day moving average, reflecting short-term bearish pressure, but remains above its 50- and 200-day averages, indicating ongoing medium- and long-term support with Ichimoku Kijun providing nearby dynamic support and the 20-day average as immediate resistance. Momentum indicators are mixed, as the MACD signals a strong trend and ADX shows active trend strength, while oscillators such as Stoch RSI and BBP highlight oversold and recently overbought conditions, underscoring heightened volatility and intraday selling pressure despite a broadly constructive backdrop.


Latest Texas Instruments News


-
 Afghanistan
-
 Albania
-
 Algeria
-
 Angola
-
 Argentina
-
 Armenia
-
 Australia
-
 Austria
-
 Azerbaijan
-
 Bahamas
-
 Bahrain
-
 Bangladesh
-
 Belarus
-
 Belgium
-
 Bolivia
-
 Botswana
-
 Brazil
-
 Brunei
-
 Bulgaria
-
 Cambodia
-
 Cameroon
-
 Canada
-
 Chile
Chile
-
 China
China
-
 Colombia
-
 Congo
Congo
-
 Costa Rica
-
 Cote d'Ivoire
-
 Croatia
-
 Cuba
Cuba
-
 Cyprus
-
 Czechia
-
 DR Congo
-
 Denmark
-
 Dominican Republic
-
 Ecuador
-
 Egypt
Egypt
-
 El Salvador
-
 Estonia
-
 Eswatini
-
 Ethiopia
-
 Finland
-
 France
-
 Georgia
-
 Germany
-
 Ghana
Ghana
-
 Greece
-
 Haiti
Haiti
-
 Hong Kong
-
 Hungary
-
 India
India
-
 Indonesia
-
 Iran, Islamic republic
-
 Iraq
Iraq
-
 Ireland
-
 Israel
-
 Italy
Italy
-
 Jamaica
-
 Japan
Japan
-
 Jordan
-
 Kazakhstan
-
 Kenya
Kenya
-
 Korea
Korea
-
 Kuwait
-
 Kyrgyzstan
-
 Laos
Laos
-
 Latvia
-
 Lebanon
-
 Lesotho
-
 Libya
Libya
-
 Lithuania
-
 Luxembourg
-
 Madagascar
-
 Malaysia
-
 Malta
Malta
-
 Mauritius
-
 Mexico
-
 Moldova
-
 Mongolia
-
 Montenegro
-
 Morocco
-
 Mozambique
-
 Myanmar
-
 Namibia
-
 Nepal
Nepal
-
 Netherlands
-
 New Zealand
-
 Nigeria
-
 North Macedonia
-
 Norway
-
 Oman
Oman
-
 Pakistan
-
 Palestine
-
 Panama
-
 Papua New Guinea
-
 Paraguay
-
 Peru
Peru
-
 Philippines
-
 Poland
-
 Portugal
-
 Puerto Rico
-
 Qatar
Qatar
-
 Reunion
-
 Romania
-
 Rwanda
-
 Saudi Arabia
-
 Serbia
-
 Singapore
-
 Slovakia
-
 Slovenia
-
 Somalia
-
 South Africa
-
 Spain
Spain
-
 Sri Lanka
-
 Sweden
-
 Switzerland
-
 Syria
Syria
-
 Taiwan
-
 Tajikistan
-
 Tanzania
-
 Thailand
-
 Trinidad and Tobago
-
 Tunisia
-
 Turkey
-
 UAE
UAE
-
 Uganda
-
 Ukraine
-
 United Kingdom
-
United States
-
 Uruguay
-
 Uzbekistan
-
 Venezuela
-
 Vietnam
-
 Yemen
Yemen
-
 Zambia
-
 Zimbabwe
- Forex
- Crypto
