
Intuit stock rises 3.05% as upbeat earnings and Anthropic deal fuel short-term rebound

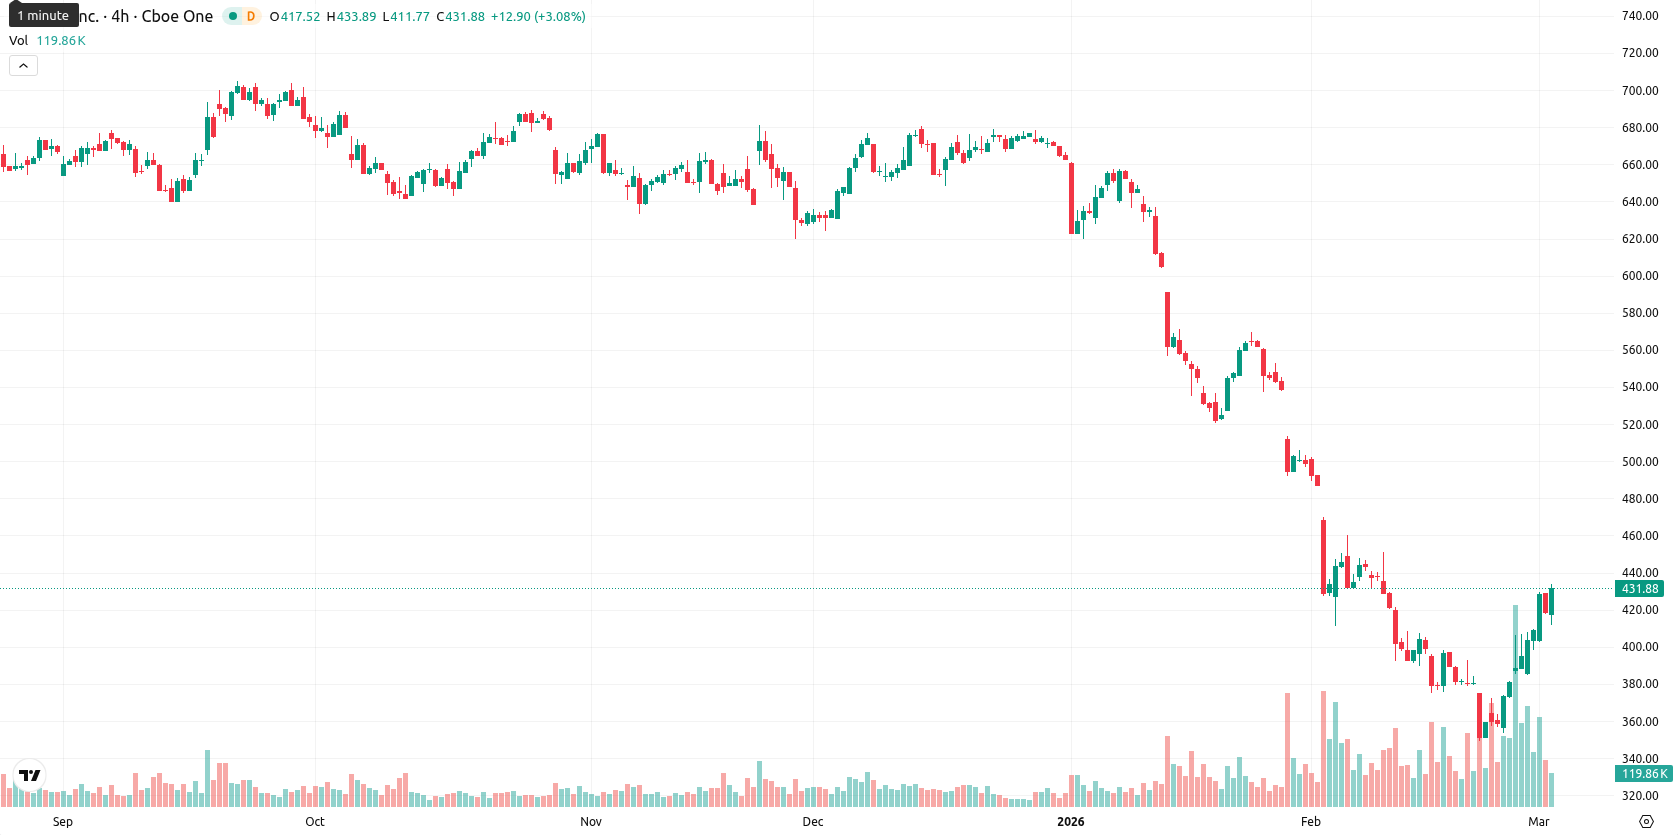
Intuit Inc. (INTU) is trading at $432.14, up 3.05% on the day. The stock is above its MA-20 ($407.70) but remains well below both the MA-50 ($528.87) and the MA-200 ($659.31), signaling a short-term rebound within an overall bearish medium- and long-term trend.
Highlights
- Intuit reported Q2 fiscal 2026 earnings and revenue above expectations, raising its full-year EPS guidance while issuing a softer Q3 outlook.
- Management approved a 15% increase in the quarterly dividend and announced a multi-year AI partnership with Anthropic to enhance TurboTax and QuickBooks.
- INTU trades at $432.14, with short-term strength capped by Ichimoku resistance at $459.19 and a baseline outlook for consolidation between $410 and $450.
Raised EPS guidance and AI partnership as mixed quarter tempers gains
Intuit recently reported Q2 fiscal 2026 earnings and revenue above expectations and raised its full-year EPS guidance, although its Q3 outlook was softer. The company announced a 15% increase in its quarterly dividend, reflecting management's confidence in its financial position. Additionally, Intuit entered a multi-year partnership with Anthropic to integrate custom AI agents into its financial platforms, aiming to enhance automation and human-assistance capabilities in products such as TurboTax and QuickBooks.
Upside persistence as resistance and overbought signals increase risk
At $432.14, INTU is trading above the MA-20 ($407.70), but well below both the MA-50 ($528.87) and MA-200 ($659.31). This suggests a short-term recovery within a still bearish medium- and long-term structure. The Ichimoku Kijun at $459.19 stands above the current price and acts as immediate resistance. Momentum signals remain cautious: the MACD indicates strong selling pressure while the ADX highlights a robust but declining trend. Oscillators present a mixed picture: the RSI on the daily chart suggests continued selling, while the Stochastic RSI and Bull/Bear Power are both in overbought territory, implying substantial recent buying but raising the risk of near-term exhaustion. Bull/Bear Power confirms that buyers are currently dominant intraday. The day opened near yesterday’s close (no gap), and price action is holding near today’s highs within a wide, volatile swing. Intraday tone shows persistent strength toward the upside, despite conflicting signals between momentum and overbought oscillators.
Downside scenario likely as technical signals undermine rebound
For the coming week, the expected five-day price range is adjusted to $410 to $450 to reflect current volatility around the prevailing level. There is a very low probability (less than 20%) of further gains, while the probability of decline is much more likely, based on persistent bearish signals from weekly MACD, RSI, ADX, and longer-term moving averages. The baseline scenario envisions price consolidating sideways between $410 and $450. A bullish scenario would require a breakout above the Ichimoku resistance at $459.19, while a bearish scenario would unfold if the price falls below $410 support, inviting renewed selling pressure.
Last time, analysts noted that Intuit Inc. is trading above its short-term moving average but remains well below medium- and long-term averages, indicating a temporary rebound amid a broader downtrend. Technical indicators present mixed momentum, with bearish signals from MACD and ADX offset by overbought oscillators and weak RSI, suggesting heightened volatility and risk of a near-term pullback below key resistance levels.


-
 Afghanistan
-
 Albania
-
 Algeria
-
 Angola
-
 Argentina
-
 Armenia
-
 Australia
-
 Austria
-
 Azerbaijan
-
 Bahamas
-
 Bahrain
-
 Bangladesh
-
 Belarus
-
 Belgium
-
 Bolivia
-
 Botswana
-
 Brazil
-
 Brunei
-
 Bulgaria
-
 Cambodia
-
 Cameroon
-
 Canada
-
 Chile
Chile
-
 China
China
-
 Colombia
-
 Congo
Congo
-
 Costa Rica
-
 Cote d'Ivoire
-
 Croatia
-
 Cuba
Cuba
-
 Cyprus
-
 Czechia
-
 DR Congo
-
 Denmark
-
 Dominican Republic
-
 Ecuador
-
 Egypt
Egypt
-
 El Salvador
-
 Estonia
-
 Eswatini
-
 Ethiopia
-
 Finland
-
 France
-
 Georgia
-
 Germany
-
 Ghana
Ghana
-
 Greece
-
 Haiti
Haiti
-
 Hong Kong
-
 Hungary
-
 India
India
-
 Indonesia
-
 Iran, Islamic republic
-
 Iraq
Iraq
-
 Ireland
-
 Israel
-
 Italy
Italy
-
 Jamaica
-
 Japan
Japan
-
 Jordan
-
 Kazakhstan
-
 Kenya
Kenya
-
 Korea
Korea
-
 Kuwait
-
 Kyrgyzstan
-
 Laos
Laos
-
 Latvia
-
 Lebanon
-
 Lesotho
-
 Libya
Libya
-
 Lithuania
-
 Luxembourg
-
 Madagascar
-
 Malaysia
-
 Malta
Malta
-
 Mauritius
-
 Mexico
-
 Moldova
-
 Mongolia
-
 Montenegro
-
 Morocco
-
 Mozambique
-
 Myanmar
-
 Namibia
-
 Nepal
Nepal
-
 Netherlands
-
 New Zealand
-
 Nigeria
-
 North Macedonia
-
 Norway
-
 Oman
Oman
-
 Pakistan
-
 Palestine
-
 Panama
-
 Papua New Guinea
-
 Paraguay
-
 Peru
Peru
-
 Philippines
-
 Poland
-
 Portugal
-
 Puerto Rico
-
 Qatar
Qatar
-
 Reunion
-
 Romania
-
 Rwanda
-
 Saudi Arabia
-
 Serbia
-
 Singapore
-
 Slovakia
-
 Slovenia
-
 Somalia
-
 South Africa
-
 Spain
Spain
-
 Sri Lanka
-
 Sweden
-
 Switzerland
-
 Syria
Syria
-
 Taiwan
-
 Tajikistan
-
 Tanzania
-
 Thailand
-
 Trinidad and Tobago
-
 Tunisia
-
 Turkey
-
 UAE
UAE
-
 Uganda
-
 Ukraine
-
 United Kingdom
-
United States
-
 Uruguay
-
 Uzbekistan
-
 Venezuela
-
 Vietnam
-
 Yemen
Yemen
-
 Zambia
-
 Zimbabwe
- Forex
- Crypto
