
INTU jumps 7.73% amid elevated volatility as bearish signals persist on technical charts – weekly report

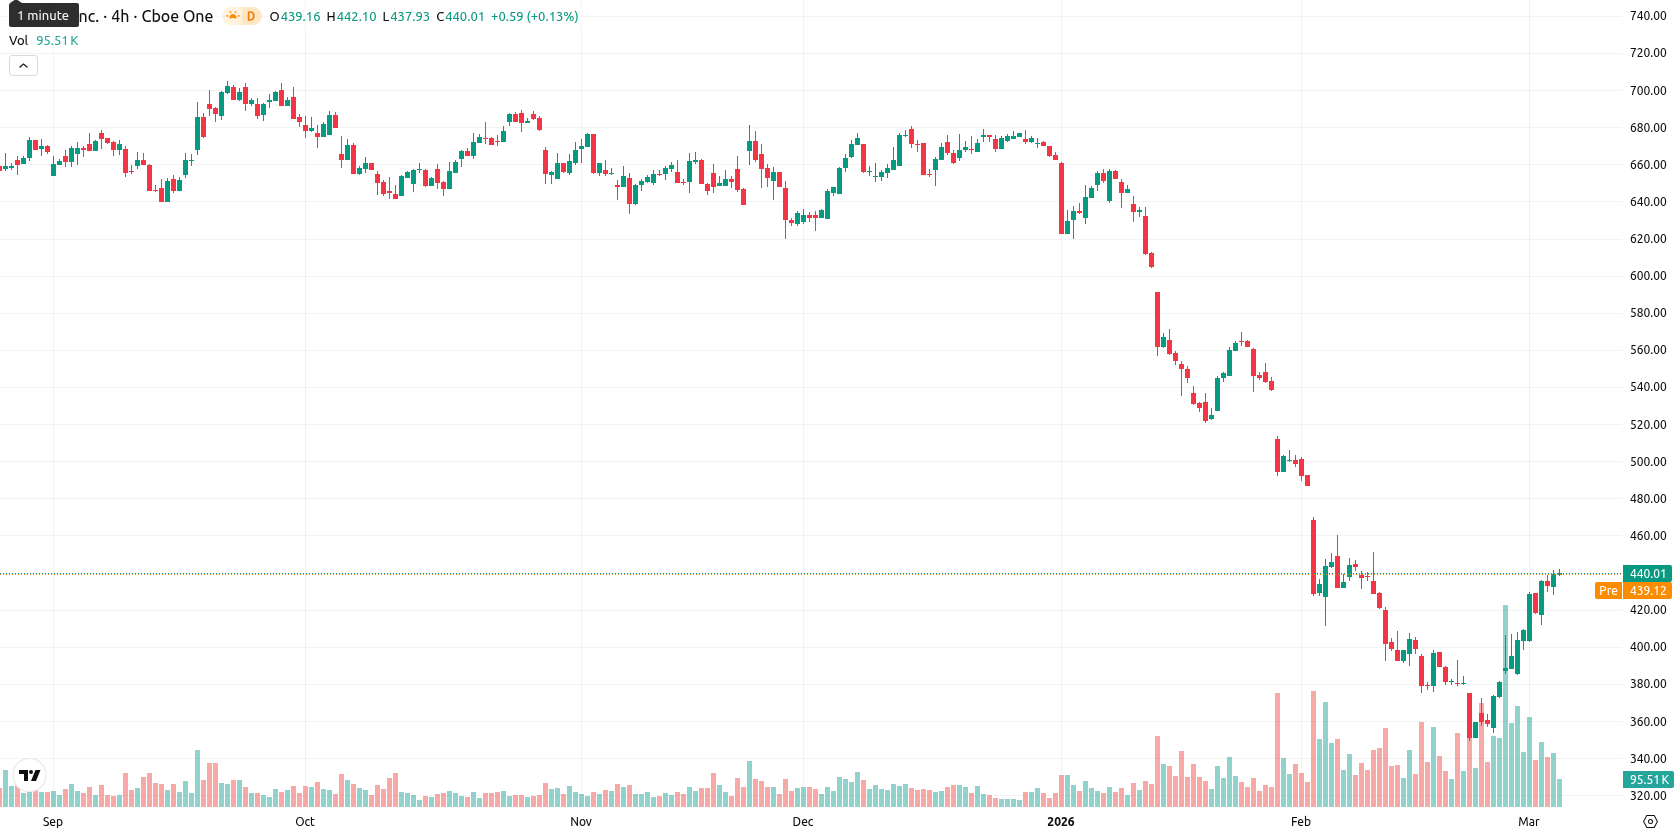
Intuit Inc. (INTU) is trading at $440.32, which is well below its weekly MA-20 at $580.41, MA-50 at $647.68, and MA-200 at $556.67, underscoring ongoing medium- and long-term downward pressure. Over the past week, the price surged by $31.59 or 7.73%, closing near the top of its weekly range despite remaining under all key moving averages.
Highlights
- Intuit remains in a persistent downtrend, trading well below key moving averages despite a 7.7% weekly price bounce.
- Most technical momentum indicators signal bearish or mixed conditions, indicating weak follow-through for the recent rebound.
- Expect high volatility within a $373.00–$490.00 weekly range, with a decline below $373.00 more likely than a sustained breakout above $490.00.
Sentiment buoyed by robust earnings, dividend hike and AI partnership
Intuit reported strong Q2 2026 results with revenue between $4.65 billion and $4.7 billion, up 17% year over year, and a non-GAAP EPS increase of 25% to $4.15. The Board approved a 15% dividend increase to $1.20 per share for payout on April 17, 2026, marking the company's 14th consecutive annual raise. Intuit also entered a partnership with Anthropic to expand AI-driven financial tools across its platforms, while continuing share repurchases supported by robust free cash flow.
Bearish momentum persists over the week despite oversold signals
On the weekly timeframe, technical indicators signal persistent bearish momentum. INTU trades well below its weekly MA-20, MA-50, and MA-200, with the Ichimoku Kijun providing additional resistance above. MACD and ADX both confirm negative momentum, while RSI and CCI linger in mildly oversold territory. Stochastic RSI remains neutral, and Bull/Bear Power signals ongoing seller dominance. Key weekly support sits near $373.00, with dynamic resistance now at the MA-50 line ($647.68), and volatility is elevated with a weekly amplitude of 14.64%.
Sideways weekly outlook favored as breakout odds remain low
For the coming week, the price is expected to fluctuate between $373.00 and $490.00, with a sideways trend in a wide range being the most probable scenario. The likelihood of sustainable gains is low (less than 20%) as none of the main weekly technical indicators currently support a bullish reversal. A break above $490.00 would indicate a bullish scenario, but remains unlikely. The bearish scenario is favored, with the potential for the price to drop below $373.00 if downward momentum persists.
Last time, analysts noted that Intuit Inc. is experiencing a short-term recovery as it trades above its 20-day moving average, though it remains well below its 50- and 200-day averages, reflecting persistent bearish medium- and long-term trends. Momentum signals are mixed, with bearish indications from the MACD and ADX contrasting with overbought short-term oscillators and immediate resistance near the Ichimoku Kijun, suggesting ongoing volatility and the risk of a near-term pullback.


-
 Afghanistan
-
 Albania
-
 Algeria
-
 Angola
-
 Argentina
-
 Armenia
-
 Australia
-
 Austria
-
 Azerbaijan
-
 Bahamas
-
 Bahrain
-
 Bangladesh
-
 Belarus
-
 Belgium
-
 Bolivia
-
 Botswana
-
 Brazil
-
 Brunei
-
 Bulgaria
-
 Cambodia
-
 Cameroon
-
 Canada
-
 Chile
Chile
-
 China
China
-
 Colombia
-
 Congo
Congo
-
 Costa Rica
-
 Cote d'Ivoire
-
 Croatia
-
 Cuba
Cuba
-
 Cyprus
-
 Czechia
-
 DR Congo
-
 Denmark
-
 Dominican Republic
-
 Ecuador
-
 Egypt
Egypt
-
 El Salvador
-
 Estonia
-
 Eswatini
-
 Ethiopia
-
 Finland
-
 France
-
 Georgia
-
 Germany
-
 Ghana
Ghana
-
 Greece
-
 Haiti
Haiti
-
 Hong Kong
-
 Hungary
-
 India
India
-
 Indonesia
-
 Iran, Islamic republic
-
 Iraq
Iraq
-
 Ireland
-
 Israel
-
 Italy
Italy
-
 Jamaica
-
 Japan
Japan
-
 Jordan
-
 Kazakhstan
-
 Kenya
Kenya
-
 Korea
Korea
-
 Kuwait
-
 Kyrgyzstan
-
 Laos
Laos
-
 Latvia
-
 Lebanon
-
 Lesotho
-
 Libya
Libya
-
 Lithuania
-
 Luxembourg
-
 Madagascar
-
 Malaysia
-
 Malta
Malta
-
 Mauritius
-
 Mexico
-
 Moldova
-
 Mongolia
-
 Montenegro
-
 Morocco
-
 Mozambique
-
 Myanmar
-
 Namibia
-
 Nepal
Nepal
-
 Netherlands
-
 New Zealand
-
 Nigeria
-
 North Macedonia
-
 Norway
-
 Oman
Oman
-
 Pakistan
-
 Palestine
-
 Panama
-
 Papua New Guinea
-
 Paraguay
-
 Peru
Peru
-
 Philippines
-
 Poland
-
 Portugal
-
 Puerto Rico
-
 Qatar
Qatar
-
 Reunion
-
 Romania
-
 Rwanda
-
 Saudi Arabia
-
 Serbia
-
 Singapore
-
 Slovakia
-
 Slovenia
-
 Somalia
-
 South Africa
-
 Spain
Spain
-
 Sri Lanka
-
 Sweden
-
 Switzerland
-
 Syria
Syria
-
 Taiwan
-
 Tajikistan
-
 Tanzania
-
 Thailand
-
 Trinidad and Tobago
-
 Tunisia
-
 Turkey
-
 UAE
UAE
-
 Uganda
-
 Ukraine
-
 United Kingdom
-
United States
-
 Uruguay
-
 Uzbekistan
-
 Venezuela
-
 Vietnam
-
 Yemen
Yemen
-
 Zambia
-
 Zimbabwe
- Forex
- Crypto
