
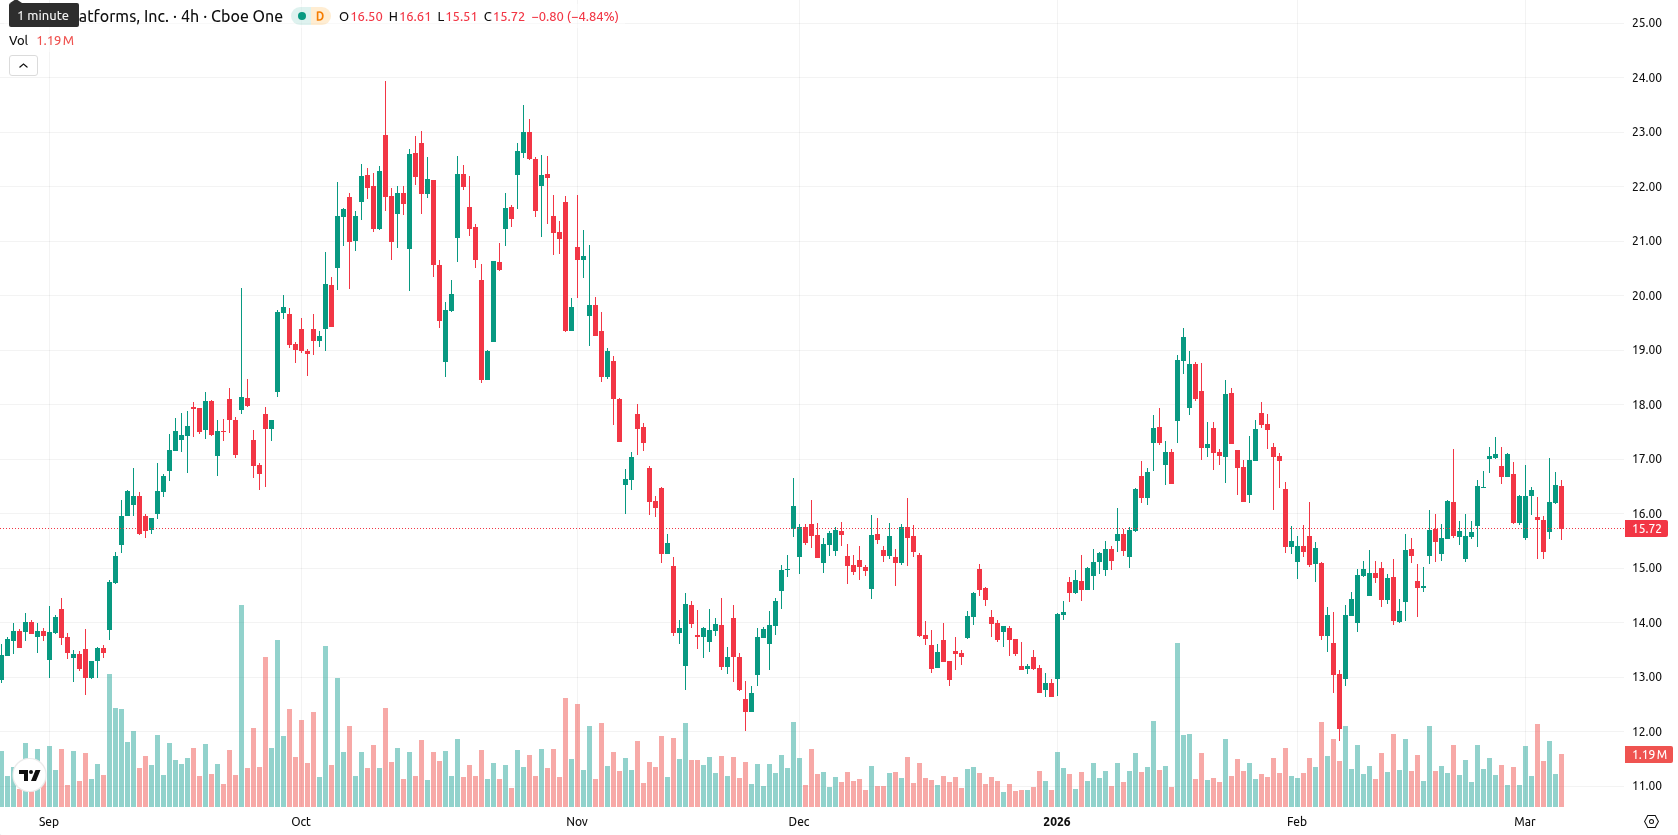
Riot Platforms stock: Mixed technical signals and engineering backlog growth drive recent decline

Riot Platforms (RIOT, formerly Riot Blockchain) is trading at $15.76 after a daily drop of 4.69%, positioning the price above the MA-20 ($15.38), MA-50 ($15.52), and MA-200 ($14.67) to confirm a bullish trend structure across all major timeframes. The Ichimoku Kijun at $14.93 serves as the nearest support beneath current levels.
Highlights
- Riot Platforms posted $647.4 million in annual revenue, driven mainly by $576.3 million from Bitcoin mining, but recorded a $663 million net loss due to accounting and unrealized cryptocurrency losses.
- Engineering division backlog surged 302% to $224.6 million from data center projects as the company expanded its Corsicana and Rockdale footprints, while cost per Bitcoin mined rose 54% year-over-year.
- RIOT trades in a bullish technical structure with an expected $14.00–$17.00 range, but current intraday action shows seller pressure and short-term downside risk despite prevailing bullish momentum signals.
Net loss widens as revenue growth coincides with rising mining costs
Riot Platforms recorded a record $647.4 million in annual revenue following its Q4 2025 earnings call, with $576.3 million attributed to Bitcoin mining, but also posted a net loss of $663 million due to accounting adjustments and unrealized losses from its cryptocurrency holdings. The company reported rapid growth in its engineering division, with a 302% increase in its backlog to $224.6 million, mainly from data center projects. Riot finalized the acquisition of additional land and a new long-term lease, expanding its data center footprint at Corsicana and Rockdale, and highlighted a 54% year-on-year rise in cost per Bitcoin mined, increasing its exposure to Bitcoin price fluctuations. These developments were accompanied by $23.2 million in capital expenditure savings from equipment synergies, though price action has remained under broader selling pressure.
Mixed momentum prevails as key averages remain intact amid session lows
Technical signals indicate mixed momentum for RIOT. The price remains above all major moving averages, and the Ichimoku Kijun at $14.93 offers the nearest support. Momentum indicators show a bullish MACD and overbought Bull/Bear Power at 0.98, while the ADX is neutral, and the Awesome Oscillator does not confirm trend direction. RSI at 53.94, Stochastic RSI at 69.47, and CCI at 74.64 register as bullish without showing excess buying, but intraday price action is weak as RIOT trades near the session low of a $15.52–$16.61 range.
Consolidation favored as breakout levels define near-term direction
For the coming week, typical volatility places RIOT in a $14.00–$17.00 band. The probability of upward movement is high (80%), but a consolidation phase is the baseline scenario with support at $14.93 and resistance at $17.00. A push above $17.00 could trigger a new leg higher, while a break below $14.93 may extend the short-term pullback.
Last time, analysts noted that Riot Platforms maintained a bullish structure across short-, medium-, and long-term trends, with the current price remaining above key moving averages despite recent volatility and intraday selling pressure. However, mixed momentum indicators and recent overbought conditions signal caution, as the stock approaches dynamic support levels while testing resistance near its medium-term averages.


Latest Riot News


-
 Afghanistan
-
 Albania
-
 Algeria
-
 Angola
-
 Argentina
-
 Armenia
-
 Australia
-
 Austria
-
 Azerbaijan
-
 Bahamas
-
 Bahrain
-
 Bangladesh
-
 Belarus
-
 Belgium
-
 Bolivia
-
 Botswana
-
 Brazil
-
 Brunei
-
 Bulgaria
-
 Cambodia
-
 Cameroon
-
 Canada
-
 Chile
Chile
-
 China
China
-
 Colombia
-
 Congo
Congo
-
 Costa Rica
-
 Cote d'Ivoire
-
 Croatia
-
 Cuba
Cuba
-
 Cyprus
-
 Czechia
-
 DR Congo
-
 Denmark
-
 Dominican Republic
-
 Ecuador
-
 Egypt
Egypt
-
 El Salvador
-
 Estonia
-
 Eswatini
-
 Ethiopia
-
 Finland
-
 France
-
 Georgia
-
 Germany
-
 Ghana
Ghana
-
 Greece
-
 Haiti
Haiti
-
 Hong Kong
-
 Hungary
-
 India
India
-
 Indonesia
-
 Iran, Islamic republic
-
 Iraq
Iraq
-
 Ireland
-
 Israel
-
 Italy
Italy
-
 Jamaica
-
 Japan
Japan
-
 Jordan
-
 Kazakhstan
-
 Kenya
Kenya
-
 Korea
Korea
-
 Kuwait
-
 Kyrgyzstan
-
 Laos
Laos
-
 Latvia
-
 Lebanon
-
 Lesotho
-
 Libya
Libya
-
 Lithuania
-
 Luxembourg
-
 Madagascar
-
 Malaysia
-
 Malta
Malta
-
 Mauritius
-
 Mexico
-
 Moldova
-
 Mongolia
-
 Montenegro
-
 Morocco
-
 Mozambique
-
 Myanmar
-
 Namibia
-
 Nepal
Nepal
-
 Netherlands
-
 New Zealand
-
 Nigeria
-
 North Macedonia
-
 Norway
-
 Oman
Oman
-
 Pakistan
-
 Palestine
-
 Panama
-
 Papua New Guinea
-
 Paraguay
-
 Peru
Peru
-
 Philippines
-
 Poland
-
 Portugal
-
 Puerto Rico
-
 Qatar
Qatar
-
 Reunion
-
 Romania
-
 Rwanda
-
 Saudi Arabia
-
 Serbia
-
 Singapore
-
 Slovakia
-
 Slovenia
-
 Somalia
-
 South Africa
-
 Spain
Spain
-
 Sri Lanka
-
 Sweden
-
 Switzerland
-
 Syria
Syria
-
 Taiwan
-
 Tajikistan
-
 Tanzania
-
 Thailand
-
 Trinidad and Tobago
-
 Tunisia
-
 Turkey
-
 UAE
UAE
-
 Uganda
-
 Ukraine
-
 United Kingdom
-
United States
-
 Uruguay
-
 Uzbekistan
-
 Venezuela
-
 Vietnam
-
 Yemen
Yemen
-
 Zambia
-
 Zimbabwe
- Forex
- Crypto
