
Bearish technical signals persist — NuCana stock drops 3.52%

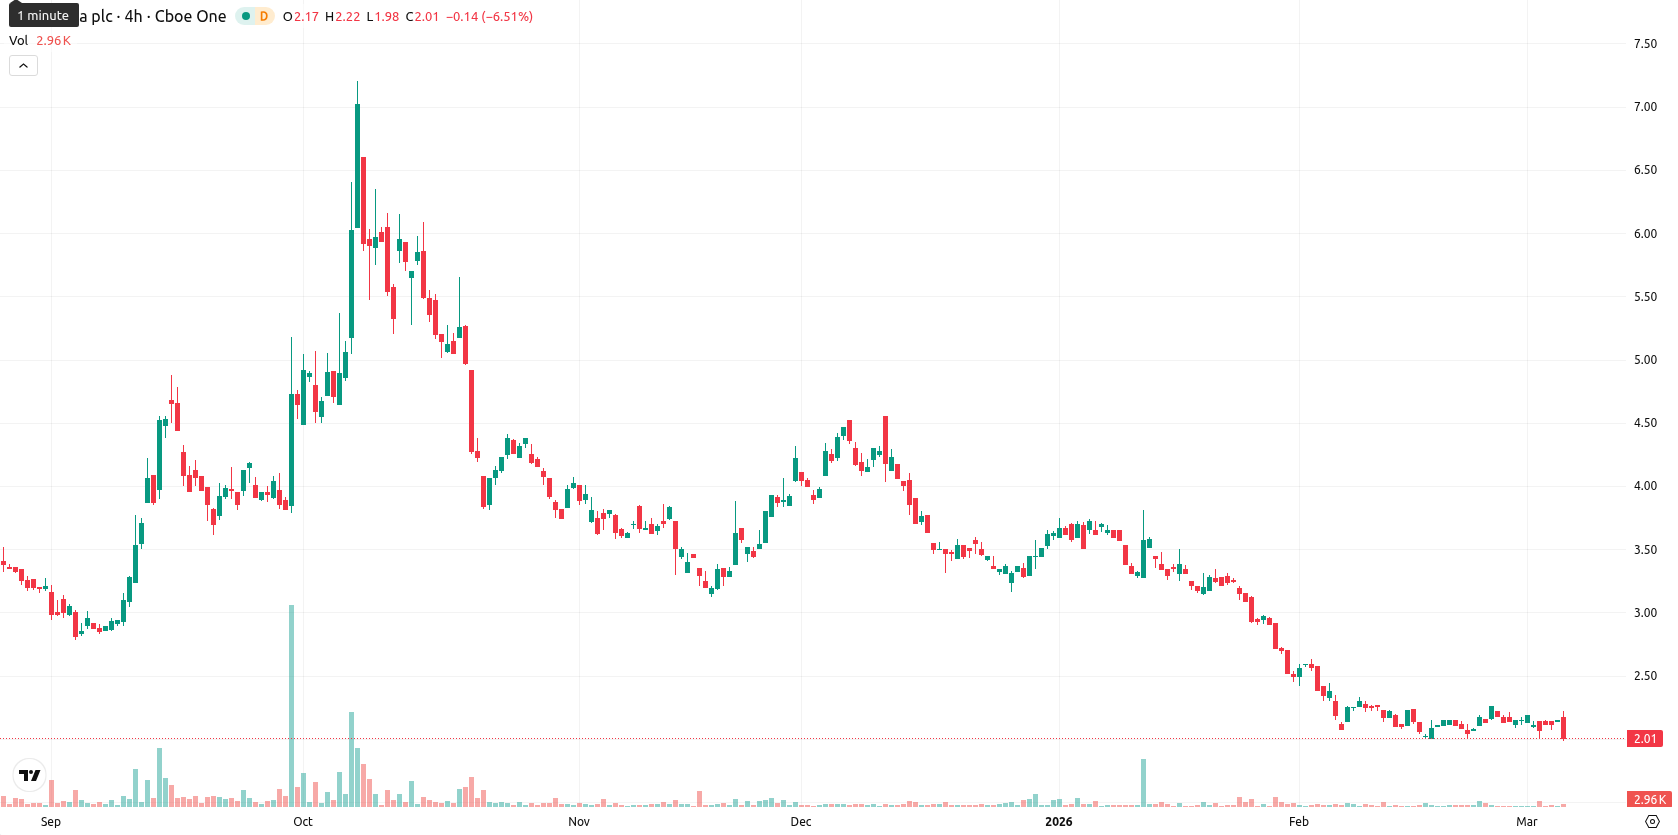
NuCana plc ADR (NCNA) is trading at $2.06 after a daily decline of 3.52%. The stock remains below its MA-20 ($2.16), MA-50 ($2.82), and MA-200 ($6.20), which indicates continued selling pressure across short, medium, and long-term trends.
Highlights
- NCNA trades below key short, medium, and long-term moving averages, confirming sustained downward price pressure.
- Bearish momentum dominates as MACD signals a strong sell and RSI reveals weak momentum without reaching oversold conditions.
- Price is forecast to range between $1.85 and $2.25 with a high probability of further declines unless resistance at $2.57 is decisively broken.
Bearish signals strengthen as resistance and momentum weaken further
NCNA is displaying a bearish technical setup, with the price under all major moving averages and the Ichimoku Kijun line on the daily chart acting as immediate resistance at $2.57. The MACD shows a strong sell signal and the ADX at 24.59 reflects a moderate but weakening trend. Other indicators, such as the daily RSI at 35.81, Stochastic RSI, and CCI, are neutral or weak, while the Bull/Bear Power is positive, hinting at some emerging buyer activity despite overall negative momentum. The stock finished the trading day near the low of its $2.03 – $2.22 range, with moderate intraday volatility and sellers dominating price action, although a minor divergence is noted in some intraday oscillators.
Downside risk persists as volatility band limits upside scenario
Over the next five trading days, NCNA is expected to fluctuate within a $1.85 to $2.25 volatility band relative to current levels. Technical signals from the weekly chart remain bearish, with RSI, MACD, and moving averages pointing lower and only ADX offering slight positive bias. There is less than a 20% probability of a sustained upward move, making further declines likely; the baseline scenario is for sideways movement within the identified range. An upward break above $2.57 would be required to trigger a bullish scenario, while a drop below $1.85 could set off a test of lower support as sellers remain in control.
Previously it was reported that NuCana plc ADR is trading below all key moving averages, with ongoing bearish momentum confirmed by negative MACD, a low RSI near oversold territory, and a weak ADX trend. Immediate resistance is identified near $2.57 with no strong support visible, suggesting a continued downside or range-bound scenario amid mixed oscillators and persistent selling pressure.


Latest NuCana News


-
 Afghanistan
-
 Albania
-
 Algeria
-
 Angola
-
 Argentina
-
 Armenia
-
 Australia
-
 Austria
-
 Azerbaijan
-
 Bahamas
-
 Bahrain
-
 Bangladesh
-
 Belarus
-
 Belgium
-
 Bolivia
-
 Botswana
-
 Brazil
-
 Brunei
-
 Bulgaria
-
 Cambodia
-
 Cameroon
-
 Canada
-
 Chile
Chile
-
 China
China
-
 Colombia
-
 Congo
Congo
-
 Costa Rica
-
 Cote d'Ivoire
-
 Croatia
-
 Cuba
Cuba
-
 Cyprus
-
 Czechia
-
 DR Congo
-
 Denmark
-
 Dominican Republic
-
 Ecuador
-
 Egypt
Egypt
-
 El Salvador
-
 Estonia
-
 Eswatini
-
 Ethiopia
-
 Finland
-
 France
-
 Georgia
-
 Germany
-
 Ghana
Ghana
-
 Greece
-
 Haiti
Haiti
-
 Hong Kong
-
 Hungary
-
 India
India
-
 Indonesia
-
 Iran, Islamic republic
-
 Iraq
Iraq
-
 Ireland
-
 Israel
-
 Italy
Italy
-
 Jamaica
-
 Japan
Japan
-
 Jordan
-
 Kazakhstan
-
 Kenya
Kenya
-
 Korea
Korea
-
 Kuwait
-
 Kyrgyzstan
-
 Laos
Laos
-
 Latvia
-
 Lebanon
-
 Lesotho
-
 Libya
Libya
-
 Lithuania
-
 Luxembourg
-
 Madagascar
-
 Malaysia
-
 Malta
Malta
-
 Mauritius
-
 Mexico
-
 Moldova
-
 Mongolia
-
 Montenegro
-
 Morocco
-
 Mozambique
-
 Myanmar
-
 Namibia
-
 Nepal
Nepal
-
 Netherlands
-
 New Zealand
-
 Nigeria
-
 North Macedonia
-
 Norway
-
 Oman
Oman
-
 Pakistan
-
 Palestine
-
 Panama
-
 Papua New Guinea
-
 Paraguay
-
 Peru
Peru
-
 Philippines
-
 Poland
-
 Portugal
-
 Puerto Rico
-
 Qatar
Qatar
-
 Reunion
-
 Romania
-
 Rwanda
-
 Saudi Arabia
-
 Serbia
-
 Singapore
-
 Slovakia
-
 Slovenia
-
 Somalia
-
 South Africa
-
 Spain
Spain
-
 Sri Lanka
-
 Sweden
-
 Switzerland
-
 Syria
Syria
-
 Taiwan
-
 Tajikistan
-
 Tanzania
-
 Thailand
-
 Trinidad and Tobago
-
 Tunisia
-
 Turkey
-
 UAE
UAE
-
 Uganda
-
 Ukraine
-
 United Kingdom
-
United States
-
 Uruguay
-
 Uzbekistan
-
 Venezuela
-
 Vietnam
-
 Yemen
Yemen
-
 Zambia
-
 Zimbabwe
- Forex
- Crypto
