
-1.90% for Tesla stock — Escalating Middle East conflict pressures consumer demand

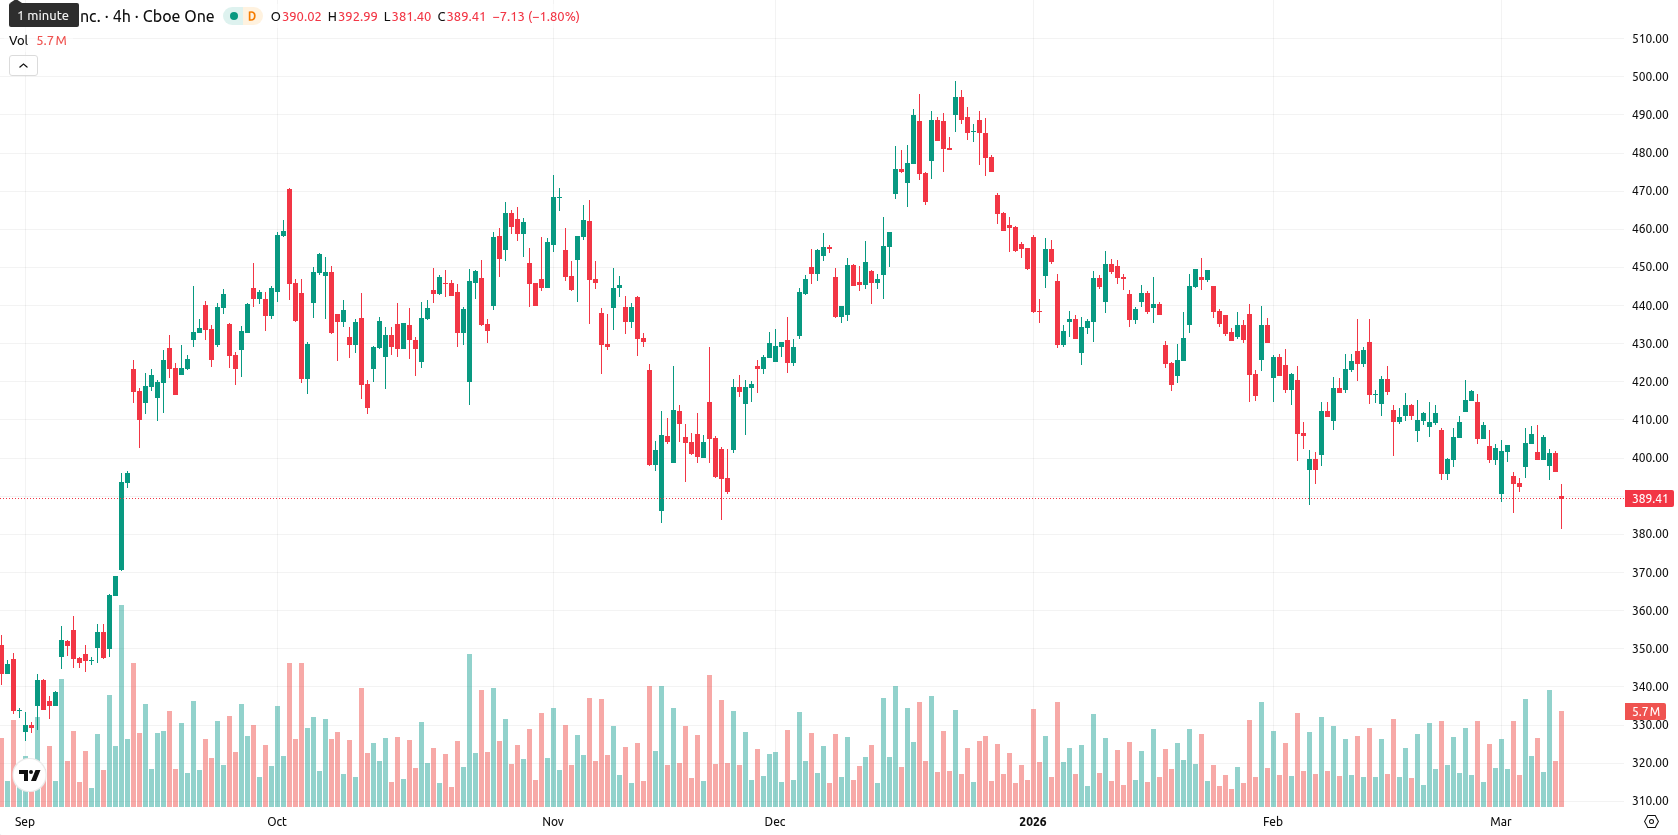
Tesla, Inc. (TSLA) is trading at $389.26, marking a daily decline of 1.90%. The asset remains below its MA-20 ($410.20), MA-50 ($428.02), and just under the MA-200 ($392.09), signaling continued downward pressure versus major moving averages.
Highlights
- Escalating Middle East tensions and rising oil prices are fueling global inflation, raising Tesla’s operating and supply chain costs.
- Heightened macroeconomic risk is eroding consumer demand for electric vehicles, threatening Tesla’s growth prospects in key Western markets.
- Tesla trades below major technical supports with short-term downward momentum, and is expected to fluctuate between $380 and $400 amid elevated volatility.
Macroeconomic risks rise as Middle East tensions boost inflation threat
Rising oil prices due to escalating Middle East tensions are exerting upward pressure on global inflation, posing a geo-economic threat to Tesla by increasing operating and supply chain costs as well as reducing consumer purchasing power for electric vehicles. The ongoing conflict dynamics have heightened macroeconomic risks, with inflationary pressures and higher consumer price index (CPI) data threatening to undermine demand for high-value discretionary goods in Tesla's key European and North American markets. Tesla remains particularly vulnerable to such macro shocks, as its valuation heavily relies on long-term growth projections and consumer confidence in the electric vehicle transition amidst global uncertainty.
Bearish signals intensify as support holds and indicators turn oversold
TSLA sits below the MA-20 and MA-50, and just beneath the MA-200 at $392.09, which is likely to act as longer-term support. Immediate resistance is noted at the Ichimoku Kijun level of $412.81. Technical indicators collectively confirm a bearish environment: MACD is in sell territory, ADX signals only mild trend strength, and RSI, Stochastic RSI, and CCI all sit in oversold or sell zones, with Bull/Bear Power also deeply negative and oversold. The Awesome Oscillator remains neutral, while persistent high volatility and continued downside after a modest gap down at the open reinforce the prevailing negative momentum, although an oversold condition increases the possibility of a bounce.
Downside bias persists as breakout risk remains limited short term
Over the coming week, TSLA is projected to fluctuate within a $380 to $400 volatility band relative to current levels. There is a low likelihood (below 20%) of a meaningful upward breakout, making further decline the more probable scenario in the near term. The baseline expectation is sideways movement within this corridor, while a sustained rally above $400 could trigger a rebound toward overhead resistance. Conversely, a break beneath $380 would highlight additional selling risk and potential for new short-term lows.
Last time, analysts noted that Tesla was trading below its key moving averages with bearish momentum dominating, as oversold conditions were confirmed by technical indicators including the RSI, MACD, and Stochastic RSI. Support is seen just under the long-term moving average while immediate resistance sits near the Ichimoku Kijun level, and with muted upside probabilities, further declines or continued sideways movement are expected in the near term.


-
 Afghanistan
-
 Albania
-
 Algeria
-
 Angola
-
 Argentina
-
 Armenia
-
 Australia
-
 Austria
-
 Azerbaijan
-
 Bahamas
-
 Bahrain
-
 Bangladesh
-
 Belarus
-
 Belgium
-
 Bolivia
-
 Botswana
-
 Brazil
-
 Brunei
-
 Bulgaria
-
 Cambodia
-
 Cameroon
-
 Canada
-
 Chile
Chile
-
 China
China
-
 Colombia
-
 Congo
Congo
-
 Costa Rica
-
 Cote d'Ivoire
-
 Croatia
-
 Cuba
Cuba
-
 Cyprus
-
 Czechia
-
 DR Congo
-
 Denmark
-
 Dominican Republic
-
 Ecuador
-
 Egypt
Egypt
-
 El Salvador
-
 Estonia
-
 Eswatini
-
 Ethiopia
-
 Finland
-
 France
-
 Georgia
-
 Germany
-
 Ghana
Ghana
-
 Greece
-
 Haiti
Haiti
-
 Hong Kong
-
 Hungary
-
 India
India
-
 Indonesia
-
 Iran, Islamic republic
-
 Iraq
Iraq
-
 Ireland
-
 Israel
-
 Italy
Italy
-
 Jamaica
-
 Japan
Japan
-
 Jordan
-
 Kazakhstan
-
 Kenya
Kenya
-
 Korea
Korea
-
 Kuwait
-
 Kyrgyzstan
-
 Laos
Laos
-
 Latvia
-
 Lebanon
-
 Lesotho
-
 Libya
Libya
-
 Lithuania
-
 Luxembourg
-
 Madagascar
-
 Malaysia
-
 Malta
Malta
-
 Mauritius
-
 Mexico
-
 Moldova
-
 Mongolia
-
 Montenegro
-
 Morocco
-
 Mozambique
-
 Myanmar
-
 Namibia
-
 Nepal
Nepal
-
 Netherlands
-
 New Zealand
-
 Nigeria
-
 North Macedonia
-
 Norway
-
 Oman
Oman
-
 Pakistan
-
 Palestine
-
 Panama
-
 Papua New Guinea
-
 Paraguay
-
 Peru
Peru
-
 Philippines
-
 Poland
-
 Portugal
-
 Puerto Rico
-
 Qatar
Qatar
-
 Reunion
-
 Romania
-
 Rwanda
-
 Saudi Arabia
-
 Serbia
-
 Singapore
-
 Slovakia
-
 Slovenia
-
 Somalia
-
 South Africa
-
 Spain
Spain
-
 Sri Lanka
-
 Sweden
-
 Switzerland
-
 Syria
Syria
-
 Taiwan
-
 Tajikistan
-
 Tanzania
-
 Thailand
-
 Trinidad and Tobago
-
 Tunisia
-
 Turkey
-
 UAE
UAE
-
 Uganda
-
 Ukraine
-
 United Kingdom
-
United States
-
 Uruguay
-
 Uzbekistan
-
 Venezuela
-
 Vietnam
-
 Yemen
Yemen
-
 Zambia
-
 Zimbabwe
- Forex
- Crypto
