
Regulatory scrutiny and insider selling — Tesla stock gains 1.46%

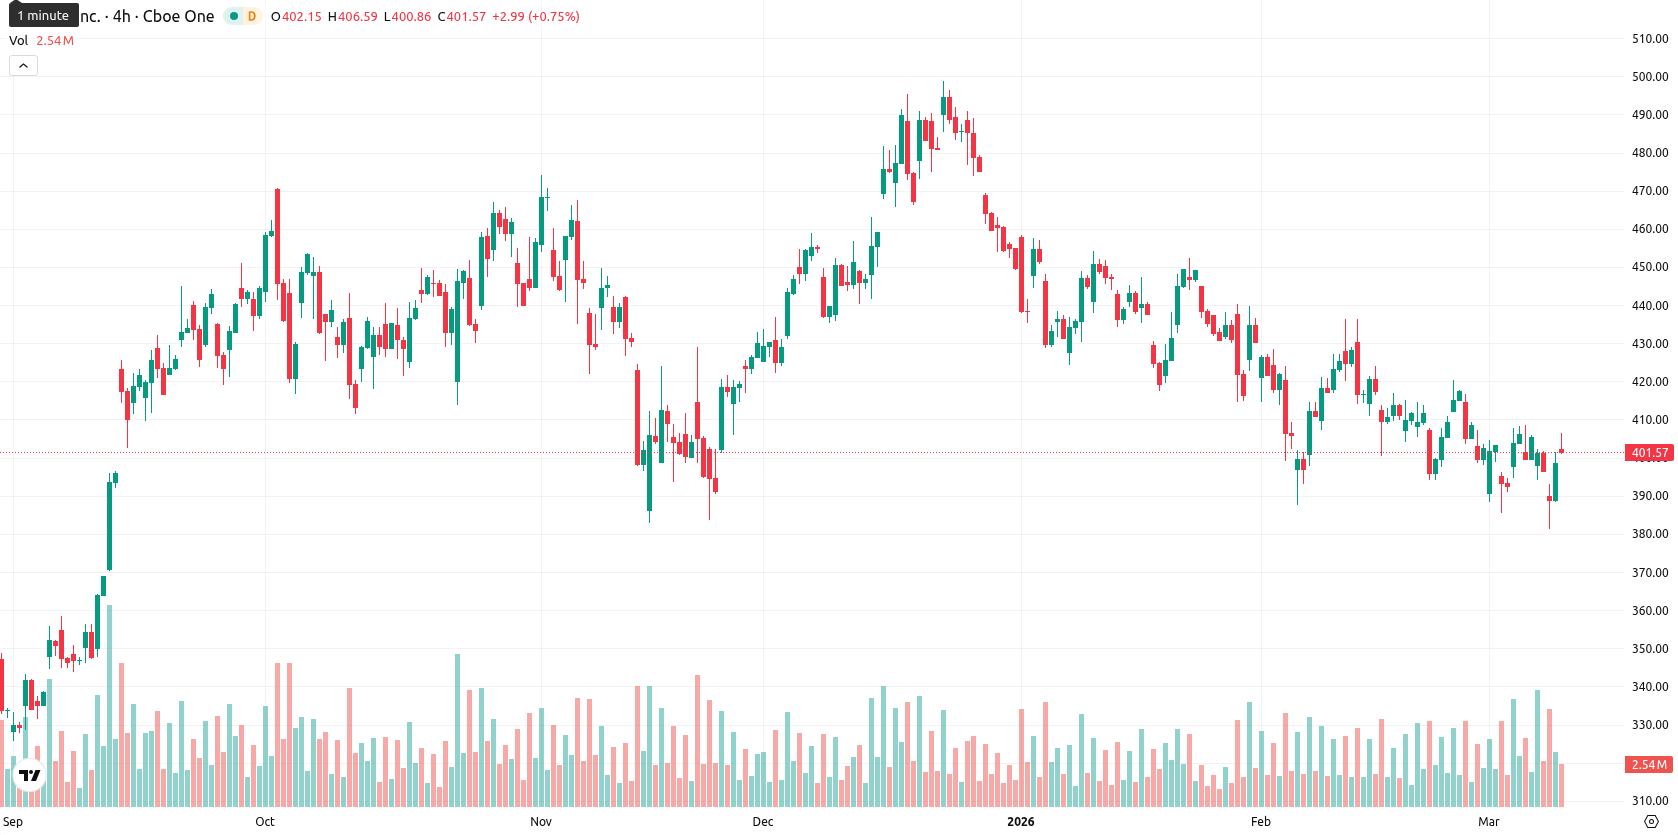
Tesla, Inc. (TSLA) is trading at $404.54, up $5.84 or 1.46% for the day. The stock has opened higher, moving near the upper end of the day's range and currently sits below both its SMA-20 ($409.56) and SMA-50 ($426.28), while remaining above its SMA-200 ($392.36).
Highlights
- Tesla faces increased regulatory scrutiny as it approaches an NHTSA deadline for providing driver-assistance technology data.
- Chief Financial Officer Vaibhav Taneja sold 2,264.5 shares for approximately $899,076 while Tesla seeks more advanced AI6 wafers from Samsung.
- Technicals indicate persistent selling pressure with low probability of near-term upside; expected trading range is $395 to $420 amid weak momentum signals.
Regulatory deadlines and insider selling drive market caution
Tesla recently faced heightened regulatory scrutiny as a deadline approached for submitting data on its driver-assistance technology to the National Highway Traffic Safety Administration (NHTSA). Insider activity was reported with Chief Financial Officer Vaibhav Taneja's sale of 2,264.5 shares worth about $899,076 on March 6, 2026, and the vesting of 6,538 restricted stock units, alongside indirect ownership changes. Tesla has also requested an increased supply of advanced AI6 wafers from Samsung to support its growing internal autonomy and robotics initiatives.
Sell pressure holds as key moving averages and weak momentum converge
Technically, TSLA is trading below both its short-term SMA-20 ($409.56) and medium-term SMA-50 ($426.28), reflecting continued selling pressure, but remains above the longer-term SMA-200 ($392.36), which serves as support. The Ichimoku Kijun level at $410.61 represents a near-term resistance zone. MACD and ADX readings on the daily interval point to weak momentum with a bearish bias, while RSI and CCI are both below midpoint, indicating the stock is not overbought and CCI signals it is closer to oversold. Bull/Bear Power (BBP) highlights sellers dominating intraday trading, though oscillator signals are mixed — Awesome Oscillator is neutral and Stoch RSI signals balance.
Limited upside as volatility favors consolidation near technical boundaries
For the next five trading days, typical volatility suggests TSLA will likely trade between $395 and $420. The probability of a further price increase is low (less than 20%), favoring additional sideways consolidation within this range. Strength above the $410 – $411 resistance would signal a potential bullish move, while a sustained drop below $395 could accelerate the decline toward the 200-day average support.
Previously it was reported that Tesla, Inc. is trading below its 20-day, 50-day, and 200-day moving averages, with technical indicators such as MACD, RSI, and Stochastic RSI confirming bearish momentum and oversold conditions. Immediate support is positioned just under the MA-200, while resistance is observed at the Ichimoku Kijun level, and volatility is expected to remain elevated with a downside bias and limited near-term breakout risk.


-
 Afghanistan
-
 Albania
-
 Algeria
-
 Angola
-
 Argentina
-
 Armenia
-
 Australia
-
 Austria
-
 Azerbaijan
-
 Bahamas
-
 Bahrain
-
 Bangladesh
-
 Belarus
-
 Belgium
-
 Bolivia
-
 Botswana
-
 Brazil
-
 Brunei
-
 Bulgaria
-
 Cambodia
-
 Cameroon
-
 Canada
-
 Chile
Chile
-
 China
China
-
 Colombia
-
 Congo
Congo
-
 Costa Rica
-
 Cote d'Ivoire
-
 Croatia
-
 Cuba
Cuba
-
 Cyprus
-
 Czechia
-
 DR Congo
-
 Denmark
-
 Dominican Republic
-
 Ecuador
-
 Egypt
Egypt
-
 El Salvador
-
 Estonia
-
 Eswatini
-
 Ethiopia
-
 Finland
-
 France
-
 Georgia
-
 Germany
-
 Ghana
Ghana
-
 Greece
-
 Haiti
Haiti
-
 Hong Kong
-
 Hungary
-
 India
India
-
 Indonesia
-
 Iran, Islamic republic
-
 Iraq
Iraq
-
 Ireland
-
 Israel
-
 Italy
Italy
-
 Jamaica
-
 Japan
Japan
-
 Jordan
-
 Kazakhstan
-
 Kenya
Kenya
-
 Korea
Korea
-
 Kuwait
-
 Kyrgyzstan
-
 Laos
Laos
-
 Latvia
-
 Lebanon
-
 Lesotho
-
 Libya
Libya
-
 Lithuania
-
 Luxembourg
-
 Madagascar
-
 Malaysia
-
 Malta
Malta
-
 Mauritius
-
 Mexico
-
 Moldova
-
 Mongolia
-
 Montenegro
-
 Morocco
-
 Mozambique
-
 Myanmar
-
 Namibia
-
 Nepal
Nepal
-
 Netherlands
-
 New Zealand
-
 Nigeria
-
 North Macedonia
-
 Norway
-
 Oman
Oman
-
 Pakistan
-
 Palestine
-
 Panama
-
 Papua New Guinea
-
 Paraguay
-
 Peru
Peru
-
 Philippines
-
 Poland
-
 Portugal
-
 Puerto Rico
-
 Qatar
Qatar
-
 Reunion
-
 Romania
-
 Rwanda
-
 Saudi Arabia
-
 Serbia
-
 Singapore
-
 Slovakia
-
 Slovenia
-
 Somalia
-
 South Africa
-
 Spain
Spain
-
 Sri Lanka
-
 Sweden
-
 Switzerland
-
 Syria
Syria
-
 Taiwan
-
 Tajikistan
-
 Tanzania
-
 Thailand
-
 Trinidad and Tobago
-
 Tunisia
-
 Turkey
-
 UAE
UAE
-
 Uganda
-
 Ukraine
-
 United Kingdom
-
United States
-
 Uruguay
-
 Uzbekistan
-
 Venezuela
-
 Vietnam
-
 Yemen
Yemen
-
 Zambia
-
 Zimbabwe
- Forex
- Crypto
