
Apple stock drops 1.81% as short-term selling pressure outweighs strong earnings report

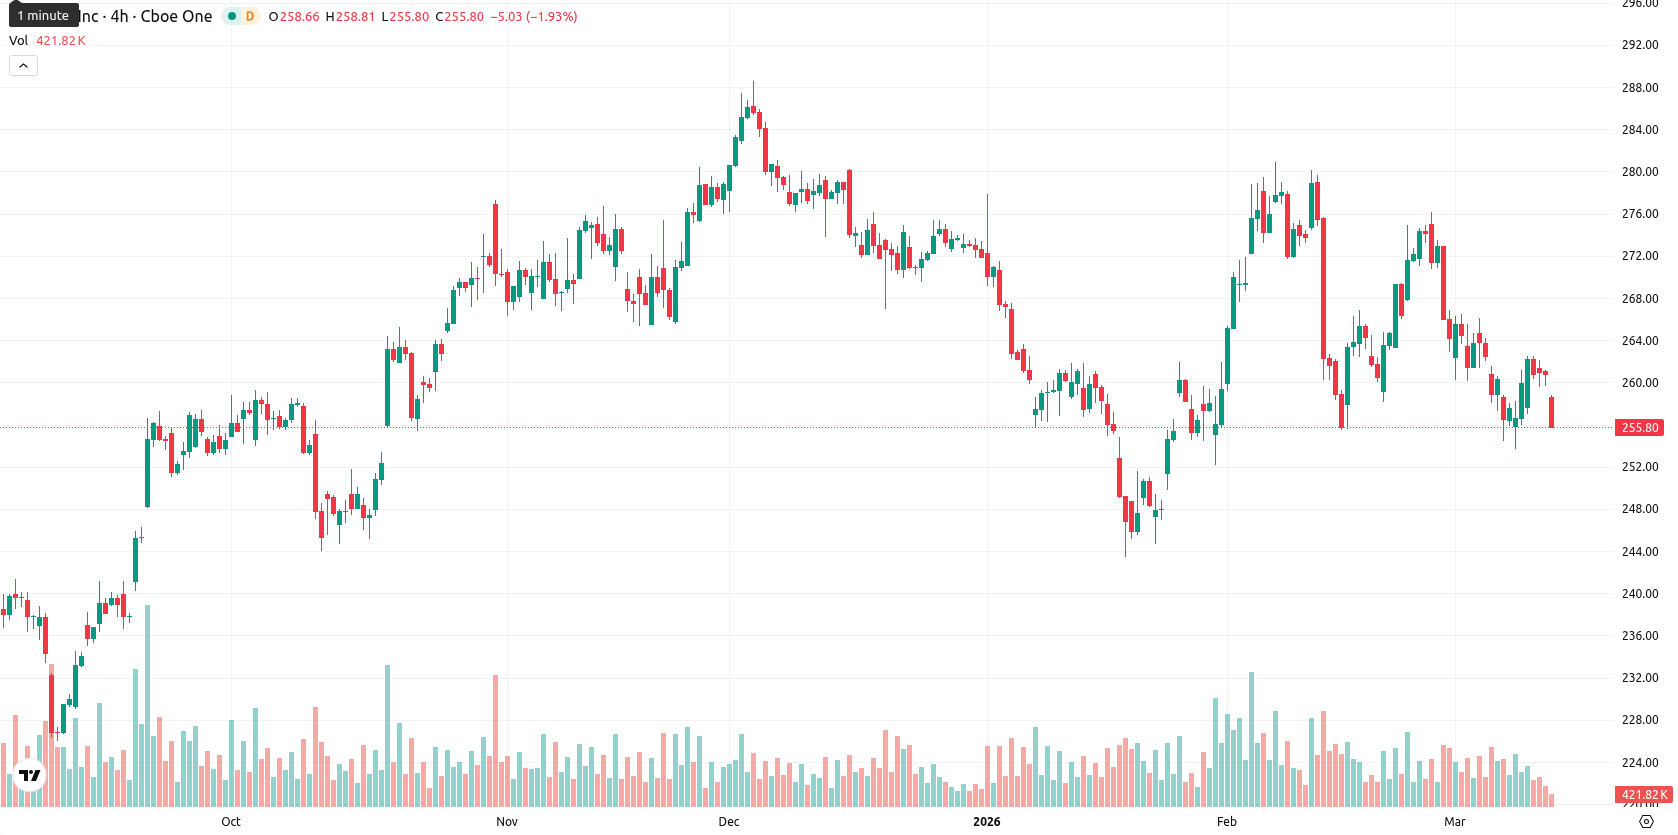
Apple Inc. (AAPL) is trading at $256.10, marking a daily move down by 1.81%. The share price sits notably below the SMA-20 ($264.30) and SMA-50 ($263.53), pointing to short- and medium-term downside pressure, yet remains above the long-term SMA-200 ($245.03), which may provide support.
Highlights
- Apple posted $143.76 billion in quarterly revenue, up 15.7% year-over-year, with EPS of $2.84 beating forecasts.
- India iPhone output surged 53% to 55 million units, supporting elevated buybacks and an increased dividend to $0.26 per share in 2026.
- Shares are under sustained selling pressure, trading below key moving averages, with indicators signaling oversold conditions and near-term support at $254.00.
Earnings beat and dividend hike support buybacks amid continued selling
Apple reported quarterly revenue of $143.76 billion, an increase of 15.7% year-over-year, and earnings per share of $2.84, exceeding analyst expectations. The company raised its quarterly dividend to $0.26 per share starting February 2026 and continued to deliver significant quarterly cash flow. India iPhone production reached 55 million units, representing a 53% growth over the previous year, and Apple's return on assets and capital remained high, supporting ongoing share buybacks. These developments accompanied stable performance from the services division, which provided recurring income, though price action has remained under broader selling pressure.
Bearish momentum endures as resistance holds and oversold signals emerge
AAPL’s price is positioned below both the SMA-20 ($264.30) and SMA-50 ($263.53), but above the SMA-200 ($245.03), suggesting continued short- and medium-term downside pressure but underpinned by longer-term support. The Ichimoku Kijun level at $267.28 acts as immediate resistance. MACD signals bearish momentum, ADX remains weak, and daily oscillators including RSI, CCI, and Stoch RSI indicate the stock is approaching or is already in oversold territory. Bull/Bear Power points to seller dominance intraday, with the Awesome Oscillator confirming prevailing bearish sentiment and no clear sign of imminent reversal despite oversold conditions.
Sideways trend favored as downside risk outweighs rebound potential
Over the next five trading days, AAPL is expected to move within a typical volatility band of $254.00 to $262.00. The probability of a price increase is low (less than 20%), with further downside more likely. The base case is for price action to trend sideways near current levels. A bearish scenario would see a breakdown below $254.00, while a bullish move would require a break above the Ichimoku Kijun and SMA-20, targeting the $262.00 level.
Last time, analysts noted that Apple shares were stabilizing just above the $260 support level, with price action hovering near resistance at $262 and needing a firmer break above this area to target the 50-day moving average near $263. Momentum indicators have improved modestly from recent lows but do not suggest a strong trend, with near-term direction likely hinging on broader macroeconomic factors such as rates and inflation rather than company fundamentals.


-
 Afghanistan
-
 Albania
-
 Algeria
-
 Angola
-
 Argentina
-
 Armenia
-
 Australia
-
 Austria
-
 Azerbaijan
-
 Bahamas
-
 Bahrain
-
 Bangladesh
-
 Belarus
-
 Belgium
-
 Bolivia
-
 Botswana
-
 Brazil
-
 Brunei
-
 Bulgaria
-
 Cambodia
-
 Cameroon
-
 Canada
-
 Chile
Chile
-
 China
China
-
 Colombia
-
 Congo
Congo
-
 Costa Rica
-
 Cote d'Ivoire
-
 Croatia
-
 Cuba
Cuba
-
 Cyprus
-
 Czechia
-
 DR Congo
-
 Denmark
-
 Dominican Republic
-
 Ecuador
-
 Egypt
Egypt
-
 El Salvador
-
 Estonia
-
 Eswatini
-
 Ethiopia
-
 Finland
-
 France
-
 Georgia
-
 Germany
-
 Ghana
Ghana
-
 Greece
-
 Haiti
Haiti
-
 Hong Kong
-
 Hungary
-
 India
India
-
 Indonesia
-
 Iran, Islamic republic
-
 Iraq
Iraq
-
 Ireland
-
 Israel
-
 Italy
Italy
-
 Jamaica
-
 Japan
Japan
-
 Jordan
-
 Kazakhstan
-
 Kenya
Kenya
-
 Korea
Korea
-
 Kuwait
-
 Kyrgyzstan
-
 Laos
Laos
-
 Latvia
-
 Lebanon
-
 Lesotho
-
 Libya
Libya
-
 Lithuania
-
 Luxembourg
-
 Madagascar
-
 Malaysia
-
 Malta
Malta
-
 Mauritius
-
 Mexico
-
 Moldova
-
 Mongolia
-
 Montenegro
-
 Morocco
-
 Mozambique
-
 Myanmar
-
 Namibia
-
 Nepal
Nepal
-
 Netherlands
-
 New Zealand
-
 Nigeria
-
 North Macedonia
-
 Norway
-
 Oman
Oman
-
 Pakistan
-
 Palestine
-
 Panama
-
 Papua New Guinea
-
 Paraguay
-
 Peru
Peru
-
 Philippines
-
 Poland
-
 Portugal
-
 Puerto Rico
-
 Qatar
Qatar
-
 Reunion
-
 Romania
-
 Rwanda
-
 Saudi Arabia
-
 Serbia
-
 Singapore
-
 Slovakia
-
 Slovenia
-
 Somalia
-
 South Africa
-
 Spain
Spain
-
 Sri Lanka
-
 Sweden
-
 Switzerland
-
 Syria
Syria
-
 Taiwan
-
 Tajikistan
-
 Tanzania
-
 Thailand
-
 Trinidad and Tobago
-
 Tunisia
-
 Turkey
-
 UAE
UAE
-
 Uganda
-
 Ukraine
-
 United Kingdom
-
United States
-
 Uruguay
-
 Uzbekistan
-
 Venezuela
-
 Vietnam
-
 Yemen
Yemen
-
 Zambia
-
 Zimbabwe
- Forex
- Crypto
