
Nano Dimension stock price forecast: Bearish setup signals further downside as NNDM falls to $1.78

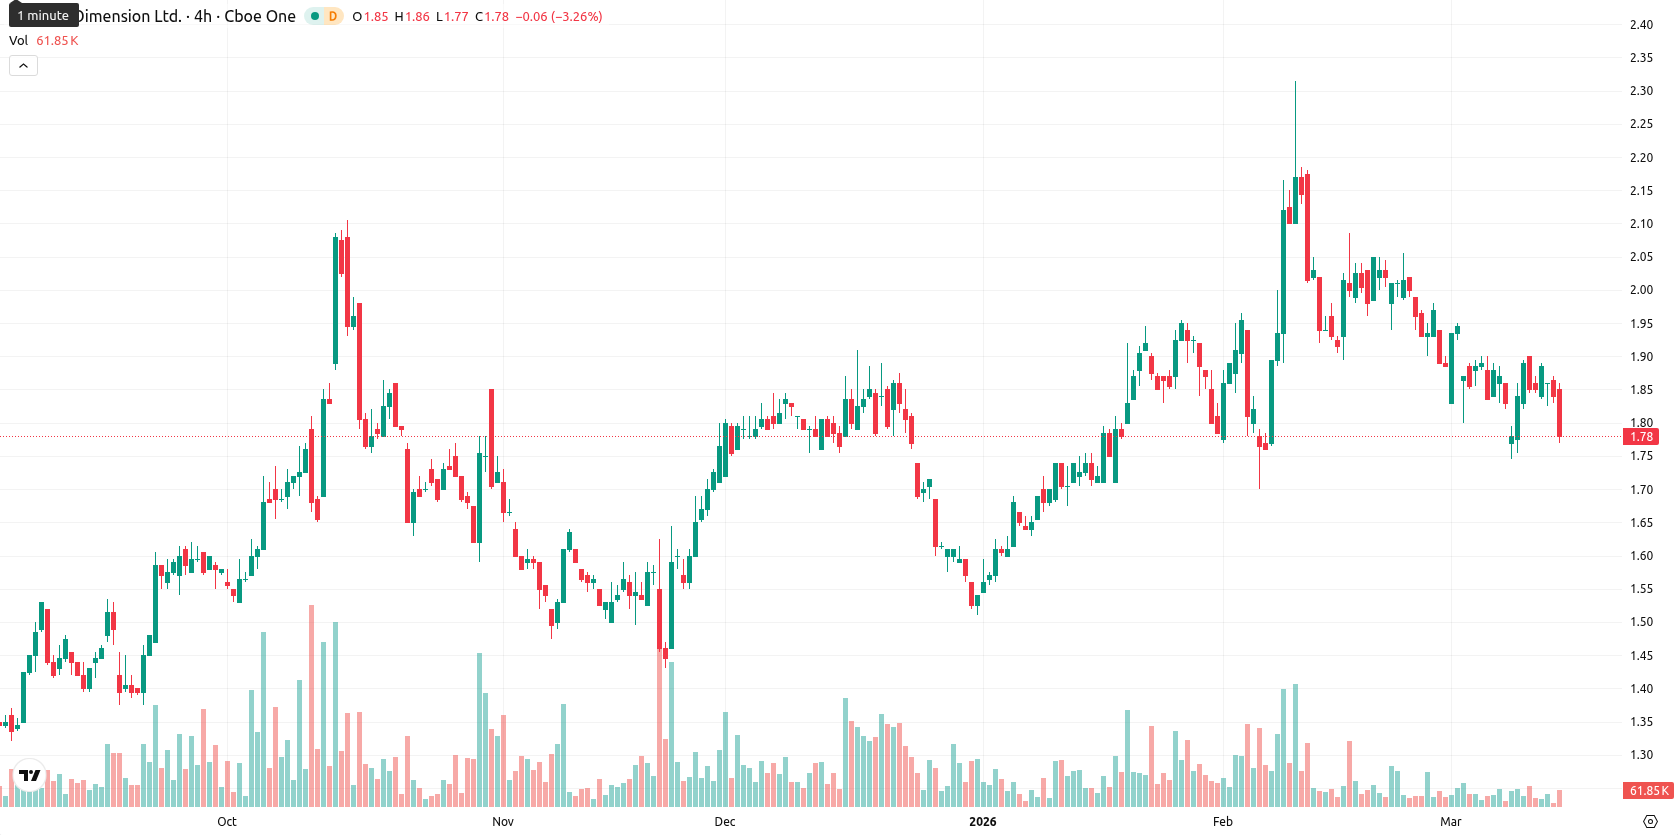
Nano Dimension Ltd. (NNDM) is trading at $1.78, marking a daily decline of 3.01%. The price sits below both the MA-20 ($1.92) and MA-50 ($1.85), but remains above the MA-200 ($1.64), indicating near-term weakness contrasted by longer-term support.
Highlights
- NNDM price maintains a long-term support above $1.64, but exhibits continued short- and medium-term bearish momentum.
- Upside momentum remains limited, with resistance at $2.01 stalling potential rebounds and sellers controlling intraday action.
- Expected trading range is $1.70–$1.88 next week, with further downside more likely than a breakout above resistance.
Bearish momentum persists as oscillators confirm oversold signals
The current price of NNDM at $1.78 trades below both the MA-20 ($1.92) and MA-50 ($1.85), but above the MA-200 ($1.64). This setup signals short- and medium-term bearish momentum, while the long-term trend finds support above the MA-200. The Ichimoku Kijun level at $2.01 stands above the current price, acting as immediate resistance. Momentum on the daily chart remains weak, with both MACD and ADX indicating negative or neutral signals. RSI at 45.18, along with oversold Stoch RSI and CCI readings, points to some downside exhaustion, but not yet a reversal. BBP is negative and aligned with "Sell," confirming the dominance of sellers in intraday action. The Awesome Oscillator also points lower, which is consistent with the broader trend. Price declined 3.01% today, opening with no gap from the prior close and now sits toward the low end of today’s range ($1.77–$1.85), signaling high intraday volatility and persistent pressure following the open. Momentum and oscillators broadly agree on weakness, with some hints of oversold conditions.
Consolidation likely as upside risk remains limited
For the coming week, the expected trading range is narrowed to $1.70–$1.88 to reflect recent price behavior and market volatility. There is a very low probability (less than 20%) of a strong upside move, while a further decline remains more likely based on the combined D1 and W1 signals. The baseline scenario is consolidation between $1.70 and $1.88. A bullish outcome would require a move above the $2.01 resistance level, while a bearish break below $1.70 could open the way for further downside.
Earlier, analysts noted that Nano Dimension was experiencing ongoing short-term weakness despite some structural long-term support. The latest data reinforces this bearish outlook, making downside risk below $1.70 the key level for traders to monitor in the coming sessions.


Latest Nano Dimension News


-
 Afghanistan
-
 Albania
-
 Algeria
-
 Angola
-
 Argentina
-
 Armenia
-
 Australia
-
 Austria
-
 Azerbaijan
-
 Bahamas
-
 Bahrain
-
 Bangladesh
-
 Belarus
-
 Belgium
-
 Bolivia
-
 Botswana
-
 Brazil
-
 Brunei
-
 Bulgaria
-
 Cambodia
-
 Cameroon
-
 Canada
-
 Chile
Chile
-
 China
China
-
 Colombia
-
 Congo
Congo
-
 Costa Rica
-
 Cote d'Ivoire
-
 Croatia
-
 Cuba
Cuba
-
 Cyprus
-
 Czechia
-
 DR Congo
-
 Denmark
-
 Dominican Republic
-
 Ecuador
-
 Egypt
Egypt
-
 El Salvador
-
 Estonia
-
 Eswatini
-
 Ethiopia
-
 Finland
-
 France
-
 Georgia
-
 Germany
-
 Ghana
Ghana
-
 Greece
-
 Haiti
Haiti
-
 Hong Kong
-
 Hungary
-
 India
India
-
 Indonesia
-
 Iran, Islamic republic
-
 Iraq
Iraq
-
 Ireland
-
 Israel
-
 Italy
Italy
-
 Jamaica
-
 Japan
Japan
-
 Jordan
-
 Kazakhstan
-
 Kenya
Kenya
-
 Korea
Korea
-
 Kuwait
-
 Kyrgyzstan
-
 Laos
Laos
-
 Latvia
-
 Lebanon
-
 Lesotho
-
 Libya
Libya
-
 Lithuania
-
 Luxembourg
-
 Madagascar
-
 Malaysia
-
 Malta
Malta
-
 Mauritius
-
 Mexico
-
 Moldova
-
 Mongolia
-
 Montenegro
-
 Morocco
-
 Mozambique
-
 Myanmar
-
 Namibia
-
 Nepal
Nepal
-
 Netherlands
-
 New Zealand
-
 Nigeria
-
 North Macedonia
-
 Norway
-
 Oman
Oman
-
 Pakistan
-
 Palestine
-
 Panama
-
 Papua New Guinea
-
 Paraguay
-
 Peru
Peru
-
 Philippines
-
 Poland
-
 Portugal
-
 Puerto Rico
-
 Qatar
Qatar
-
 Reunion
-
 Romania
-
 Rwanda
-
 Saudi Arabia
-
 Serbia
-
 Singapore
-
 Slovakia
-
 Slovenia
-
 Somalia
-
 South Africa
-
 Spain
Spain
-
 Sri Lanka
-
 Sweden
-
 Switzerland
-
 Syria
Syria
-
 Taiwan
-
 Tajikistan
-
 Tanzania
-
 Thailand
-
 Trinidad and Tobago
-
 Tunisia
-
 Turkey
-
 UAE
UAE
-
 Uganda
-
 Ukraine
-
 United Kingdom
-
United States
-
 Uruguay
-
 Uzbekistan
-
 Venezuela
-
 Vietnam
-
 Yemen
Yemen
-
 Zambia
-
 Zimbabwe
- Forex
- Crypto
