
Hut 8 stock: Bearish momentum drives a 5.09% daily loss below short-term averages

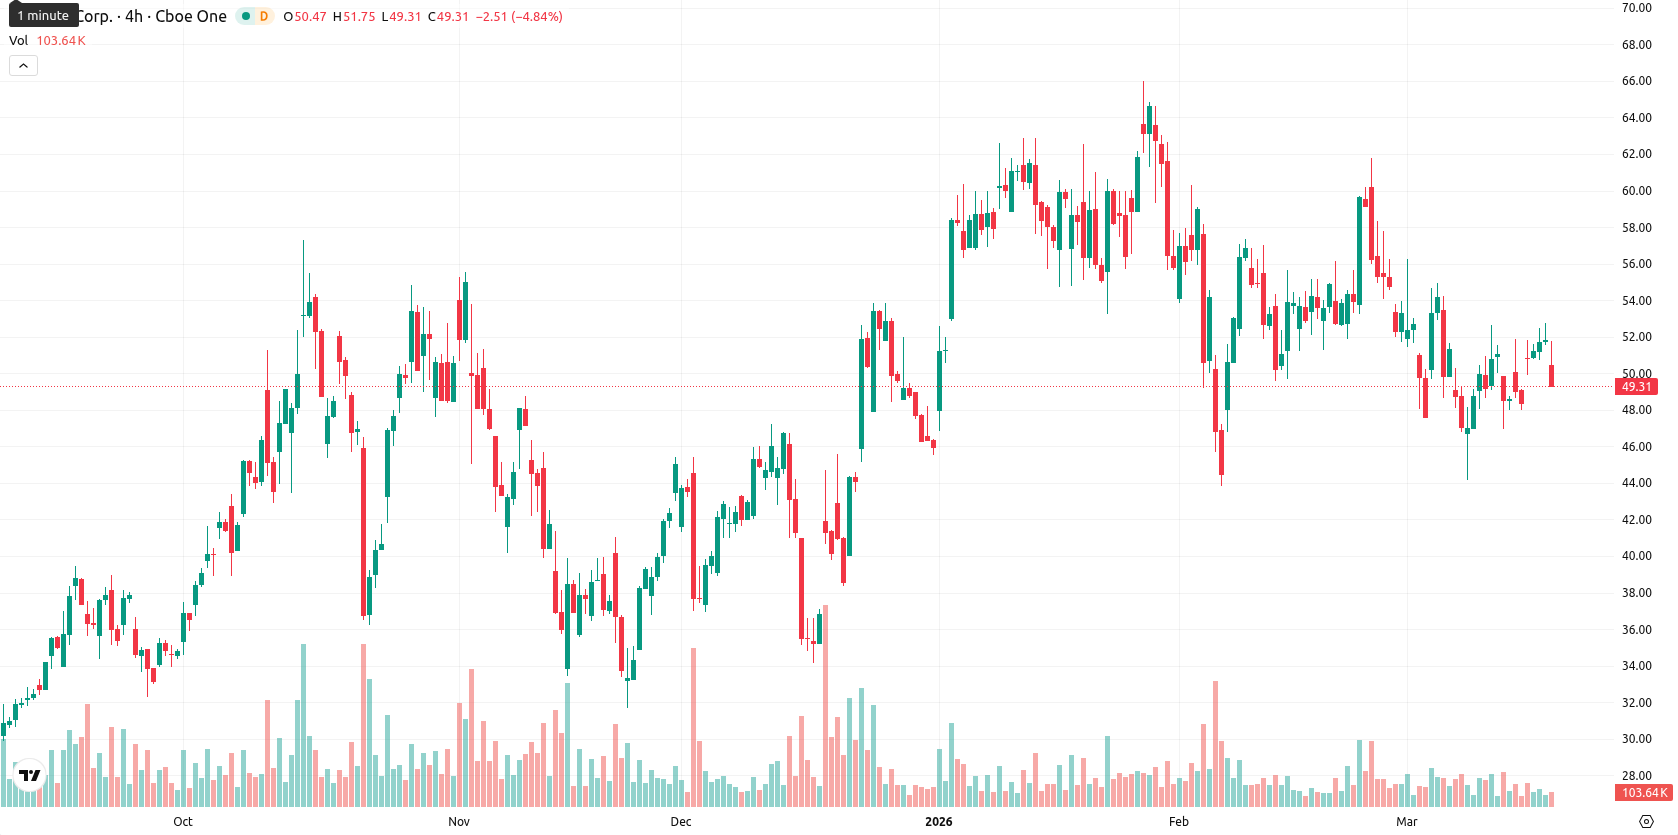
Hut 8 Corp (HUT) is trading at $49.15, down 5.09% on the day. The price remains below the SMA-20 at $52.04 and SMA-50 at $55.03, indicating ongoing short- and medium-term downward pressure, but still sits well above the long-term SMA-200 at $38.07.
Highlights
- HUT is trading below key short- and medium-term averages, indicating persistent downward pressure despite solid long-term support near $38.00.
- Momentum and oscillator signals are mixed, with most indicators now shifting in favor of sellers and suggesting potential near-term reversal risk.
- Expect HUT to trade sideways in a $49.00–$52.50 range next week, with high probability of a rebound if resistance at $53.00 breaks.
Momentum divergence deepens as short-term weakness counters long-term support
The current price of HUT at $49.15 trades below the SMA-20 at $52.04 and SMA-50 at $55.03, signaling short- and medium-term downward pressure, but remains well above the SMA-200 at $38.07, reflecting underlying long-term support. The Ichimoku Kijun level is $52.97, which now acts as immediate resistance for any recovery attempts.
Momentum signals are mixed: MACD on the daily is a strong sell and ADX is neutral, indicating weak trend strength and fading positive momentum. Daily RSI is at 49.70 and flashing a sell, while Stoch RSI is in a pronounced overbought zone, suggesting potential reversal risk. Both CCI and AO are neutral, but BBP at 1.85 highlights recent buyer dominance, though today's drop of 5.09% and a move from the open ($50.64) to current levels underscores intensified seller pressure. There was no significant gap between the previous close and today’s open, and the price sits near the low end of today’s range, reflecting high intraday volatility and persistent downside tone after the open. While BBP hints at previous buyer activity, most oscillators and momentum signals point to an ongoing shift toward sellers, with notable divergence between short-term momentum and earlier buying pressure.
Bullish scenario likely as weekly technicals overpower near-term volatility
For the coming week, expect HUT to trade between $49.00 and $52.50. The likelihood of a price increase is very high (more than 80%) given the combined bullish signals from the weekly MA-50, MA-100, MA-200, RSI, and MACD. A decline is less likely in the short term. The baseline scenario is a sideways move within a typical volatility band of $49.00 to $52.50, with a bullish scenario seeing a possible break above $53.00 resistance if momentum turns positive, while a bearish scenario could see a fall below $49.00 triggering further profit-taking toward the $48.00 — $47.50 area.
Earlier, analysts noted that Hut 8 faced persistent short- and medium-term downside pressures despite retaining longer-term support. With fresh momentum signals highlighting potential reversal risk amid intensified intraday volatility, traders should closely monitor the $49.00 level as a pivotal point for either a renewed recovery or further short-term downside.


-
 Afghanistan
-
 Albania
-
 Algeria
-
 Angola
-
 Argentina
-
 Armenia
-
 Australia
-
 Austria
-
 Azerbaijan
-
 Bahamas
-
 Bahrain
-
 Bangladesh
-
 Belarus
-
 Belgium
-
 Bolivia
-
 Botswana
-
 Brazil
-
 Brunei
-
 Bulgaria
-
 Cambodia
-
 Cameroon
-
 Canada
-
 Chile
Chile
-
 China
China
-
 Colombia
-
 Congo
Congo
-
 Costa Rica
-
 Cote d'Ivoire
-
 Croatia
-
 Cuba
Cuba
-
 Cyprus
-
 Czechia
-
 DR Congo
-
 Denmark
-
 Dominican Republic
-
 Ecuador
-
 Egypt
Egypt
-
 El Salvador
-
 Estonia
-
 Eswatini
-
 Ethiopia
-
 Finland
-
 France
-
 Georgia
-
 Germany
-
 Ghana
Ghana
-
 Greece
-
 Haiti
Haiti
-
 Hong Kong
-
 Hungary
-
 India
India
-
 Indonesia
-
 Iran, Islamic republic
-
 Iraq
Iraq
-
 Ireland
-
 Israel
-
 Italy
Italy
-
 Jamaica
-
 Japan
Japan
-
 Jordan
-
 Kazakhstan
-
 Kenya
Kenya
-
 Korea
Korea
-
 Kuwait
-
 Kyrgyzstan
-
 Laos
Laos
-
 Latvia
-
 Lebanon
-
 Lesotho
-
 Libya
Libya
-
 Lithuania
-
 Luxembourg
-
 Madagascar
-
 Malaysia
-
 Malta
Malta
-
 Mauritius
-
 Mexico
-
 Moldova
-
 Mongolia
-
 Montenegro
-
 Morocco
-
 Mozambique
-
 Myanmar
-
 Namibia
-
 Nepal
Nepal
-
 Netherlands
-
 New Zealand
-
 Nigeria
-
 North Macedonia
-
 Norway
-
 Oman
Oman
-
 Pakistan
-
 Palestine
-
 Panama
-
 Papua New Guinea
-
 Paraguay
-
 Peru
Peru
-
 Philippines
-
 Poland
-
 Portugal
-
 Puerto Rico
-
 Qatar
Qatar
-
 Reunion
-
 Romania
-
 Rwanda
-
 Saudi Arabia
-
 Serbia
-
 Singapore
-
 Slovakia
-
 Slovenia
-
 Somalia
-
 South Africa
-
 Spain
Spain
-
 Sri Lanka
-
 Sweden
-
 Switzerland
-
 Syria
Syria
-
 Taiwan
-
 Tajikistan
-
 Tanzania
-
 Thailand
-
 Trinidad and Tobago
-
 Tunisia
-
 Turkey
-
 UAE
UAE
-
 Uganda
-
 Ukraine
-
 United Kingdom
-
United States
-
 Uruguay
-
 Uzbekistan
-
 Venezuela
-
 Vietnam
-
 Yemen
Yemen
-
 Zambia
-
 Zimbabwe
- Forex
- Crypto
