
AMD stock: Seller pressure and weak momentum drive slight dip below SMA-20

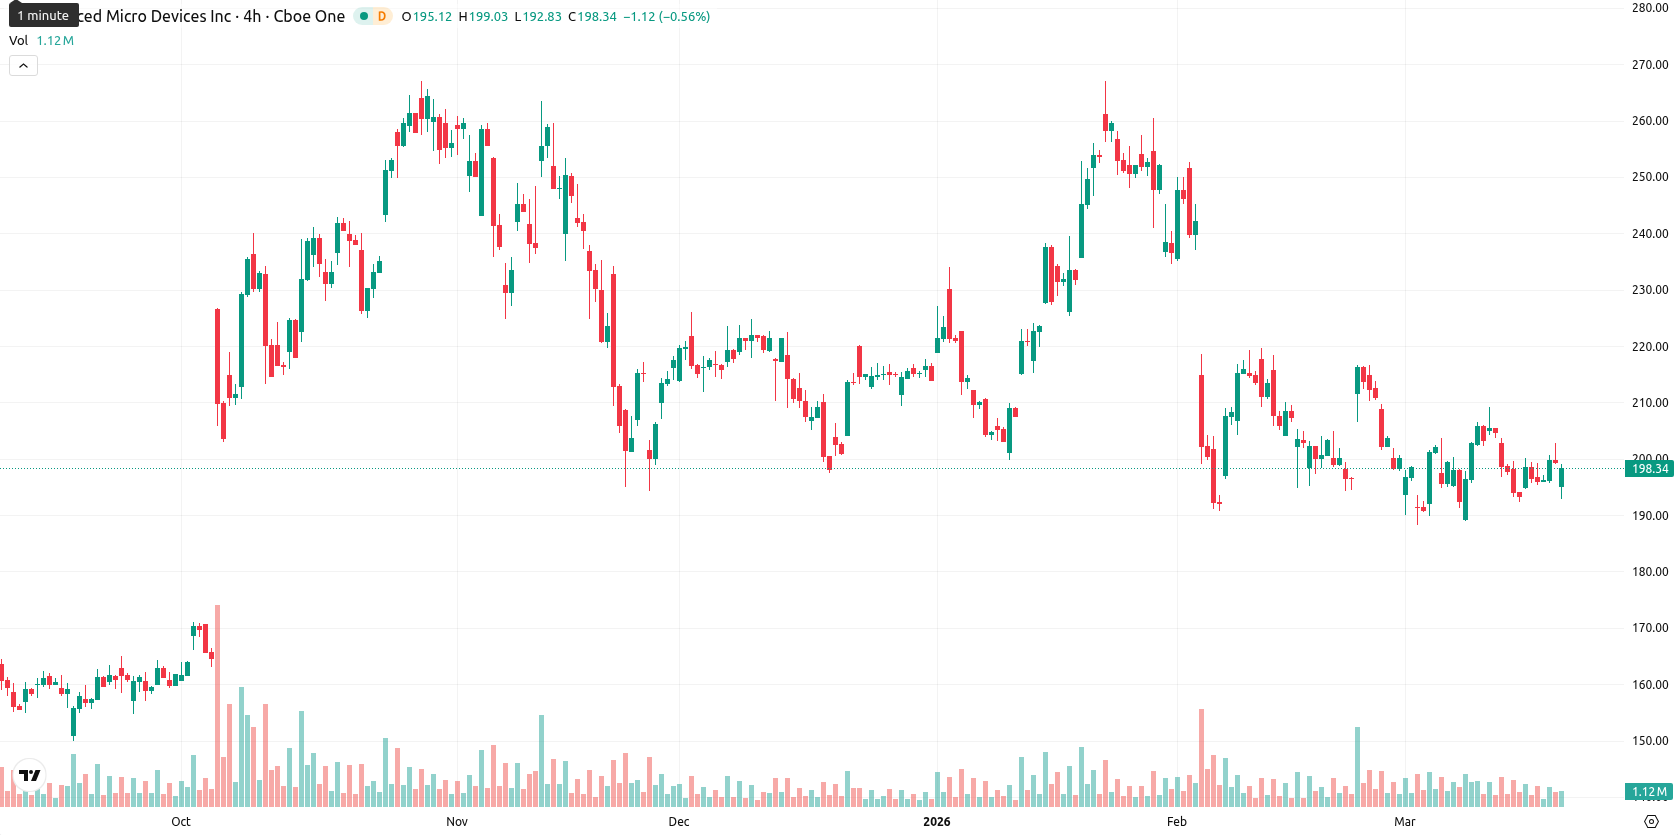
Advanced Micro Devices, Inc. (AMD) is trading at $198.73, down 0.37% for the session. The price is below the SMA-20 ($200.33) and notably beneath the SMA-50 ($214.80), but remains above the long-term SMA-200 ($192.09), indicating ongoing medium-term seller pressure while longer-term support is intact. Immediate resistance is identified at the Ichimoku Kijun level of $203.94.
Highlights
- AMD is trading below key short- and medium-term moving averages, indicating ongoing seller pressure despite long-term support.
- Momentum signals remain mixed, with short-term indicators showing negative bias and overbought conditions, while trend strength is weak.
- Price is likely to trade between $190 and $205 this week, with a bearish bias unless resistance at $204 is broken.
Bullish intraday signals diverge as momentum weakens
Short-term momentum indicators are negative, with the MACD showing a strong sell signal and ADX pointing to a weak trend. RSI is in neutral-sell territory, and both Stoch RSI and BBP flag the setup as overbought, while CCI is neutral near zero and the Awesome Oscillator is also neutral. Bull/Bear Power's overbought read and positive value indicate intraday buyer dominance, but momentum indicators as a whole present a mixed view, reflecting a divergence between short-term bullish activity and a lack of decisive trend.
Downside bias expected as breakout risks remain low
For the coming week, AMD is likely to trade within a typical volatility band spanning $190 to $205. Probabilities indicate less than a 20% chance of a sustained price increase, favoring a further decline. The baseline scenario is price stabilization between support in the low $190s and resistance near $204. A bullish move would require a clear break above $204 targeting $205, while a drop below $192 would signal additional downside risk.
Previously it was reported that AMD was facing persistent medium-term selling pressure despite some underlying long-term support. The current analysis reinforces this cautious stance, with attention now shifting to whether buyers can meaningfully challenge resistance near $204 or if a breakdown below $192 will initiate a further leg lower.


Latest AMD News


-
 Afghanistan
-
 Albania
-
 Algeria
-
 Angola
-
 Argentina
-
 Armenia
-
 Australia
-
 Austria
-
 Azerbaijan
-
 Bahamas
-
 Bahrain
-
 Bangladesh
-
 Belarus
-
 Belgium
-
 Bolivia
-
 Botswana
-
 Brazil
-
 Brunei
-
 Bulgaria
-
 Cambodia
-
 Cameroon
-
 Canada
-
 Chile
Chile
-
 China
China
-
 Colombia
-
 Congo
Congo
-
 Costa Rica
-
 Cote d'Ivoire
-
 Croatia
-
 Cuba
Cuba
-
 Cyprus
-
 Czechia
-
 DR Congo
-
 Denmark
-
 Dominican Republic
-
 Ecuador
-
 Egypt
Egypt
-
 El Salvador
-
 Estonia
-
 Eswatini
-
 Ethiopia
-
 Finland
-
 France
-
 Georgia
-
 Germany
-
 Ghana
Ghana
-
 Greece
-
 Haiti
Haiti
-
 Hong Kong
-
 Hungary
-
 India
India
-
 Indonesia
-
 Iran, Islamic republic
-
 Iraq
Iraq
-
 Ireland
-
 Israel
-
 Italy
Italy
-
 Jamaica
-
 Japan
Japan
-
 Jordan
-
 Kazakhstan
-
 Kenya
Kenya
-
 Korea
Korea
-
 Kuwait
-
 Kyrgyzstan
-
 Laos
Laos
-
 Latvia
-
 Lebanon
-
 Lesotho
-
 Libya
Libya
-
 Lithuania
-
 Luxembourg
-
 Madagascar
-
 Malaysia
-
 Malta
Malta
-
 Mauritius
-
 Mexico
-
 Moldova
-
 Mongolia
-
 Montenegro
-
 Morocco
-
 Mozambique
-
 Myanmar
-
 Namibia
-
 Nepal
Nepal
-
 Netherlands
-
 New Zealand
-
 Nigeria
-
 North Macedonia
-
 Norway
-
 Oman
Oman
-
 Pakistan
-
 Palestine
-
 Panama
-
 Papua New Guinea
-
 Paraguay
-
 Peru
Peru
-
 Philippines
-
 Poland
-
 Portugal
-
 Puerto Rico
-
 Qatar
Qatar
-
 Reunion
-
 Romania
-
 Rwanda
-
 Saudi Arabia
-
 Serbia
-
 Singapore
-
 Slovakia
-
 Slovenia
-
 Somalia
-
 South Africa
-
 Spain
Spain
-
 Sri Lanka
-
 Sweden
-
 Switzerland
-
 Syria
Syria
-
 Taiwan
-
 Tajikistan
-
 Tanzania
-
 Thailand
-
 Trinidad and Tobago
-
 Tunisia
-
 Turkey
-
 UAE
UAE
-
 Uganda
-
 Ukraine
-
 United Kingdom
-
United States
-
 Uruguay
-
 Uzbekistan
-
 Venezuela
-
 Vietnam
-
 Yemen
Yemen
-
 Zambia
-
 Zimbabwe
- Forex
- Crypto
