
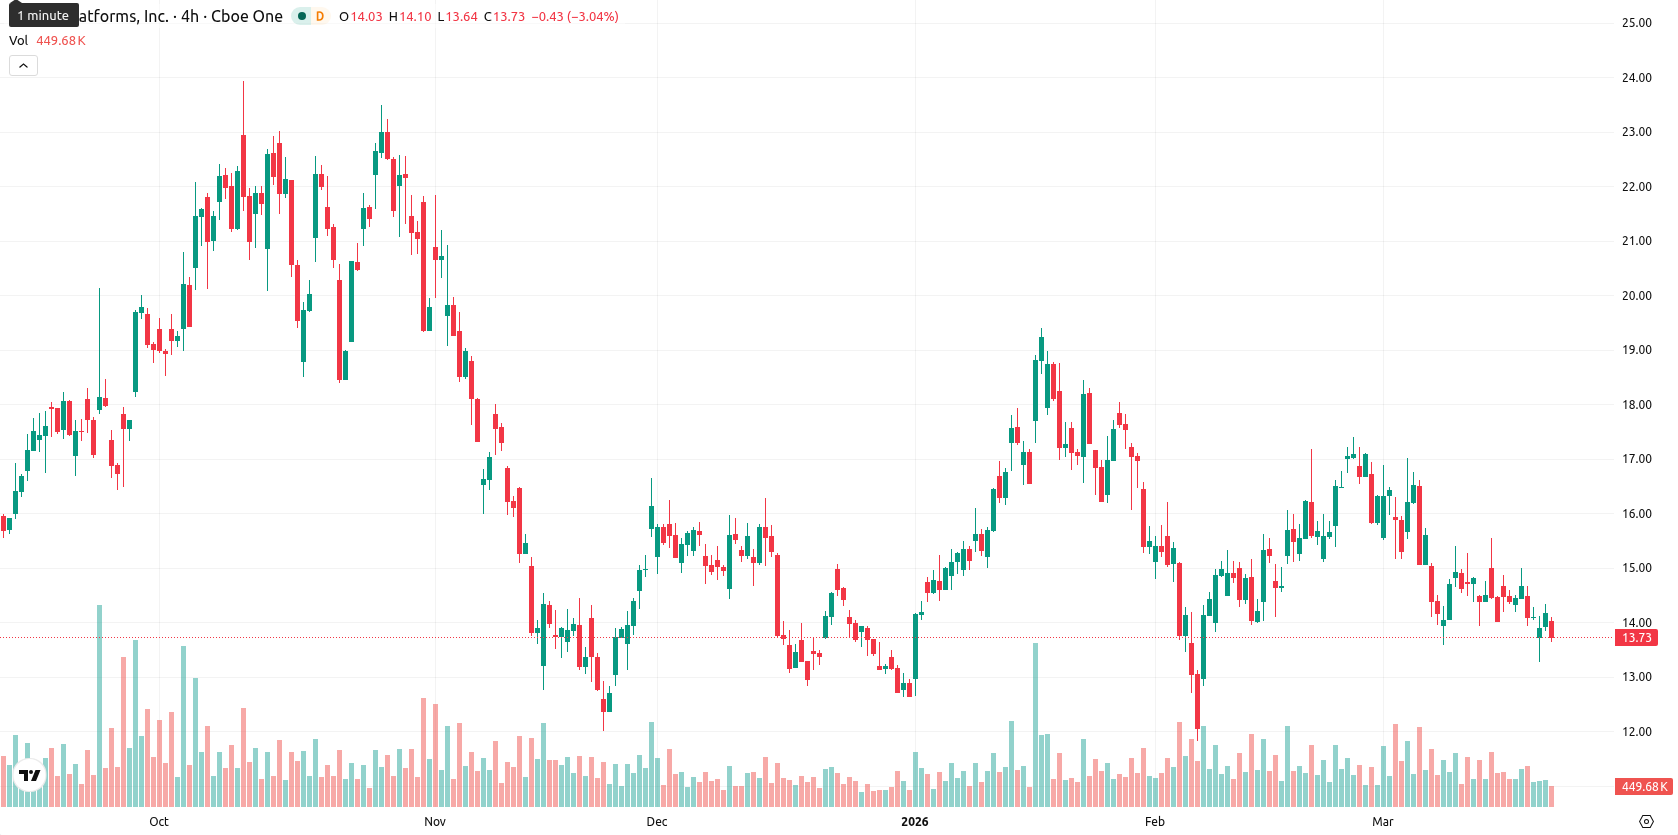
Technical pressures intensify: Riot Platforms stock slides 3.11%

Riot Platforms (RIOT) is trading at $13.70, below its SMA-20 ($15.32), SMA-50 ($15.67), and SMA-200 ($14.99), indicating persistent downward pressure in short-, medium-, and long-term trends. The Ichimoku Kijun level stands at $15.34, which acts as immediate resistance above the current price.
Highlights
- RIOT trades below major moving averages, indicating persistent downward pressure across all timeframes.
- Momentum and sentiment indicators signal strong bearish control, with oversold readings and negative price action prevailing.
- Expected five-day trading range is $13.00 to $14.80, with less than 20% probability of a price increase.
Bearish momentum confirmed as indicators signal oversold territory
Momentum indicators reflect weakening sentiment, with MACD projecting a sell signal and ADX at a low reading, suggesting a lack of clear trend strength. RSI, CCI, and Stoch RSI all point to oversold conditions, while BBP at -0.38 highlights that sellers dominate intraday action. The AO is also negative, reinforcing the current downward bias. RIOT fell 3.11% today, with no material gap between the previous close ($14.14) and today’s open ($14.03). The price is currently near today’s low, and the session has shown moderate volatility with pressure persisting after the open. All intraday dynamics and momentum signals are aligned, confirming strong short-term bearish control.
Range-bound outlook favors downside risk amid low upside probability
Looking ahead over the next five trading days, a volatility band relative to current levels is estimated between $13.00 and $14.80. The probability of a price increase is very low (less than 20%), making a decline more likely. In the baseline scenario, RIOT remains range-bound between $13.00 and $14.80. For a bullish move, the price needs to break above immediate resistance at $15.34, opening space toward $14.80 and higher. A bearish scenario unfolds if RIOT drops below $13.00, which could trigger accelerated selling toward lower supports.
Earlier, analysts noted that Riot Platforms was experiencing persistent selling pressure and weak momentum, casting doubt on the prospect of a near-term rebound. The current analysis reinforces this bearish stance, with new momentum metrics suggesting traders should closely monitor the $13.00 level as a potential inflection point for further downside risk.


Latest Riot News


-
 Afghanistan
-
 Albania
-
 Algeria
-
 Angola
-
 Argentina
-
 Armenia
-
 Australia
-
 Austria
-
 Azerbaijan
-
 Bahamas
-
 Bahrain
-
 Bangladesh
-
 Belarus
-
 Belgium
-
 Bolivia
-
 Botswana
-
 Brazil
-
 Brunei
-
 Bulgaria
-
 Cambodia
-
 Cameroon
-
 Canada
-
 Chile
Chile
-
 China
China
-
 Colombia
-
 Congo
Congo
-
 Costa Rica
-
 Cote d'Ivoire
-
 Croatia
-
 Cuba
Cuba
-
 Cyprus
-
 Czechia
-
 DR Congo
-
 Denmark
-
 Dominican Republic
-
 Ecuador
-
 Egypt
Egypt
-
 El Salvador
-
 Estonia
-
 Eswatini
-
 Ethiopia
-
 Finland
-
 France
-
 Georgia
-
 Germany
-
 Ghana
Ghana
-
 Greece
-
 Haiti
Haiti
-
 Hong Kong
-
 Hungary
-
 India
India
-
 Indonesia
-
 Iran, Islamic republic
-
 Iraq
Iraq
-
 Ireland
-
 Israel
-
 Italy
Italy
-
 Jamaica
-
 Japan
Japan
-
 Jordan
-
 Kazakhstan
-
 Kenya
Kenya
-
 Korea
Korea
-
 Kuwait
-
 Kyrgyzstan
-
 Laos
Laos
-
 Latvia
-
 Lebanon
-
 Lesotho
-
 Libya
Libya
-
 Lithuania
-
 Luxembourg
-
 Madagascar
-
 Malaysia
-
 Malta
Malta
-
 Mauritius
-
 Mexico
-
 Moldova
-
 Mongolia
-
 Montenegro
-
 Morocco
-
 Mozambique
-
 Myanmar
-
 Namibia
-
 Nepal
Nepal
-
 Netherlands
-
 New Zealand
-
 Nigeria
-
 North Macedonia
-
 Norway
-
 Oman
Oman
-
 Pakistan
-
 Palestine
-
 Panama
-
 Papua New Guinea
-
 Paraguay
-
 Peru
Peru
-
 Philippines
-
 Poland
-
 Portugal
-
 Puerto Rico
-
 Qatar
Qatar
-
 Reunion
-
 Romania
-
 Rwanda
-
 Saudi Arabia
-
 Serbia
-
 Singapore
-
 Slovakia
-
 Slovenia
-
 Somalia
-
 South Africa
-
 Spain
Spain
-
 Sri Lanka
-
 Sweden
-
 Switzerland
-
 Syria
Syria
-
 Taiwan
-
 Tajikistan
-
 Tanzania
-
 Thailand
-
 Trinidad and Tobago
-
 Tunisia
-
 Turkey
-
 UAE
UAE
-
 Uganda
-
 Ukraine
-
 United Kingdom
-
United States
-
 Uruguay
-
 Uzbekistan
-
 Venezuela
-
 Vietnam
-
 Yemen
Yemen
-
 Zambia
-
 Zimbabwe
- Forex
- Crypto
