
Hut 8 stock drops 3.13% as momentum indicators turn bearish despite long-term support

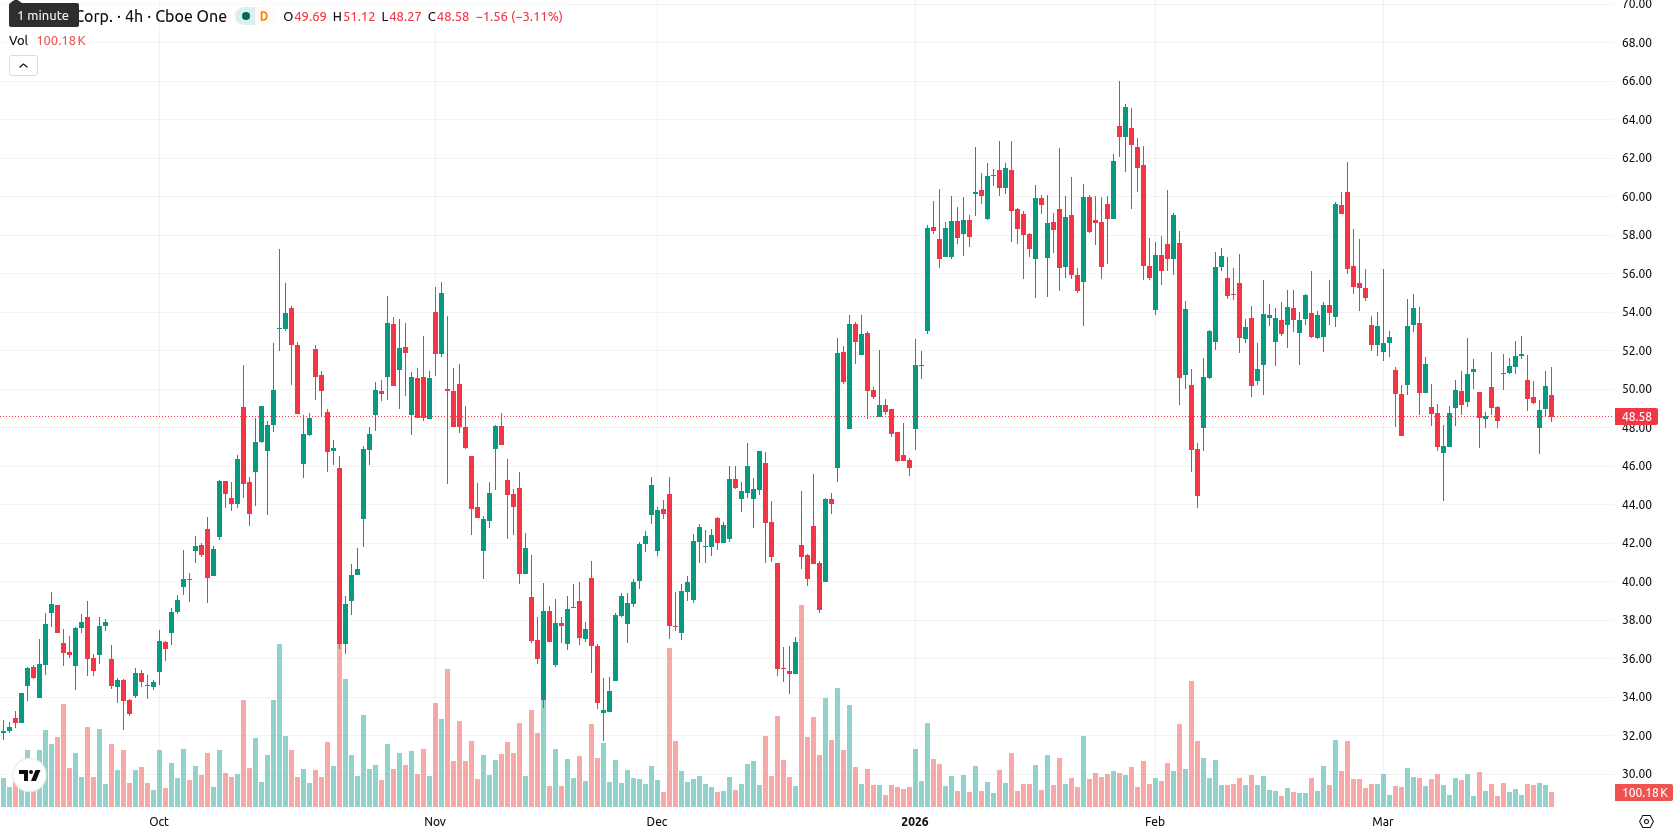
Hut 8 Corp (HUT) is trading at $48.57, reflecting a sharp daily drop of 3.13%. The stock sits below both its SMA-20 ($51.59) and SMA-50 ($54.69), indicating ongoing short- and medium-term downward pressure, but remains well above its SMA-200 ($38.42), underscoring longer-term technical support.
Highlights
- HUT remains under short- and medium-term downside pressure, trading below key moving averages but finds longer-term support above the 200-day level.
- Bearish momentum dominates as major technical indicators align with a recent sharp drop and strong intraday selling activity.
- Price is expected to consolidate between $47.90 and $50.70 next week, with a high probability of a moderate rebound if support holds.
Mild bearish momentum as technical signals conflict near resistance
Momentum is negative, with the D1 MACD showing a strong sell signal and the ADX indicating weak trend strength. The RSI at 47.40 and CCI at –66.55 both point to mild bearish momentum, though neither is deeply oversold. Stoch RSI is elevated at 70.70, hinting at potential rebound attempts, while BBP confirms intraday seller dominance and oversold conditions. The Ichimoku Kijun on D1 stands at $52.97, which sets immediate resistance above the current price, and volatility has remained high with the price near today's low after heavy selling from the open.
Consolidation likely as upside probability outweighs downside risk
For the coming week, HUT is likely to trade within a typical volatility band of $47.90 – $50.70. The probability of an upward move is high (over 80%), with further downside seen as less likely. Baseline expectations are for price consolidation within this range, while a sustainable bullish move would need a break above the $52.97 resistance. If $47.90 support fails, a renewed decline could develop, though longer-term momentum remains bullish and suggests limited further downside.
Earlier, analysts noted that Hut 8 was facing continued downward pressure over the short and medium term, despite retaining longer-term technical support. The current analysis strengthens this outlook by highlighting sustained bearish momentum and elevated volatility, making a decisive move above the $52.97 resistance a critical signal for any potential recovery.


-
 Afghanistan
-
 Albania
-
 Algeria
-
 Angola
-
 Argentina
-
 Armenia
-
 Australia
-
 Austria
-
 Azerbaijan
-
 Bahamas
-
 Bahrain
-
 Bangladesh
-
 Belarus
-
 Belgium
-
 Bolivia
-
 Botswana
-
 Brazil
-
 Brunei
-
 Bulgaria
-
 Cambodia
-
 Cameroon
-
 Canada
-
 Chile
Chile
-
 China
China
-
 Colombia
-
 Congo
Congo
-
 Costa Rica
-
 Cote d'Ivoire
-
 Croatia
-
 Cuba
Cuba
-
 Cyprus
-
 Czechia
-
 DR Congo
-
 Denmark
-
 Dominican Republic
-
 Ecuador
-
 Egypt
Egypt
-
 El Salvador
-
 Estonia
-
 Eswatini
-
 Ethiopia
-
 Finland
-
 France
-
 Georgia
-
 Germany
-
 Ghana
Ghana
-
 Greece
-
 Haiti
Haiti
-
 Hong Kong
-
 Hungary
-
 India
India
-
 Indonesia
-
 Iran, Islamic republic
-
 Iraq
Iraq
-
 Ireland
-
 Israel
-
 Italy
Italy
-
 Jamaica
-
 Japan
Japan
-
 Jordan
-
 Kazakhstan
-
 Kenya
Kenya
-
 Korea
Korea
-
 Kuwait
-
 Kyrgyzstan
-
 Laos
Laos
-
 Latvia
-
 Lebanon
-
 Lesotho
-
 Libya
Libya
-
 Lithuania
-
 Luxembourg
-
 Madagascar
-
 Malaysia
-
 Malta
Malta
-
 Mauritius
-
 Mexico
-
 Moldova
-
 Mongolia
-
 Montenegro
-
 Morocco
-
 Mozambique
-
 Myanmar
-
 Namibia
-
 Nepal
Nepal
-
 Netherlands
-
 New Zealand
-
 Nigeria
-
 North Macedonia
-
 Norway
-
 Oman
Oman
-
 Pakistan
-
 Palestine
-
 Panama
-
 Papua New Guinea
-
 Paraguay
-
 Peru
Peru
-
 Philippines
-
 Poland
-
 Portugal
-
 Puerto Rico
-
 Qatar
Qatar
-
 Reunion
-
 Romania
-
 Rwanda
-
 Saudi Arabia
-
 Serbia
-
 Singapore
-
 Slovakia
-
 Slovenia
-
 Somalia
-
 South Africa
-
 Spain
Spain
-
 Sri Lanka
-
 Sweden
-
 Switzerland
-
 Syria
Syria
-
 Taiwan
-
 Tajikistan
-
 Tanzania
-
 Thailand
-
 Trinidad and Tobago
-
 Tunisia
-
 Turkey
-
 UAE
UAE
-
 Uganda
-
 Ukraine
-
 United Kingdom
-
United States
-
 Uruguay
-
 Uzbekistan
-
 Venezuela
-
 Vietnam
-
 Yemen
Yemen
-
 Zambia
-
 Zimbabwe
- Forex
- Crypto
