
AMD stock rises 2.82% as price holds above key support but faces overbought signals

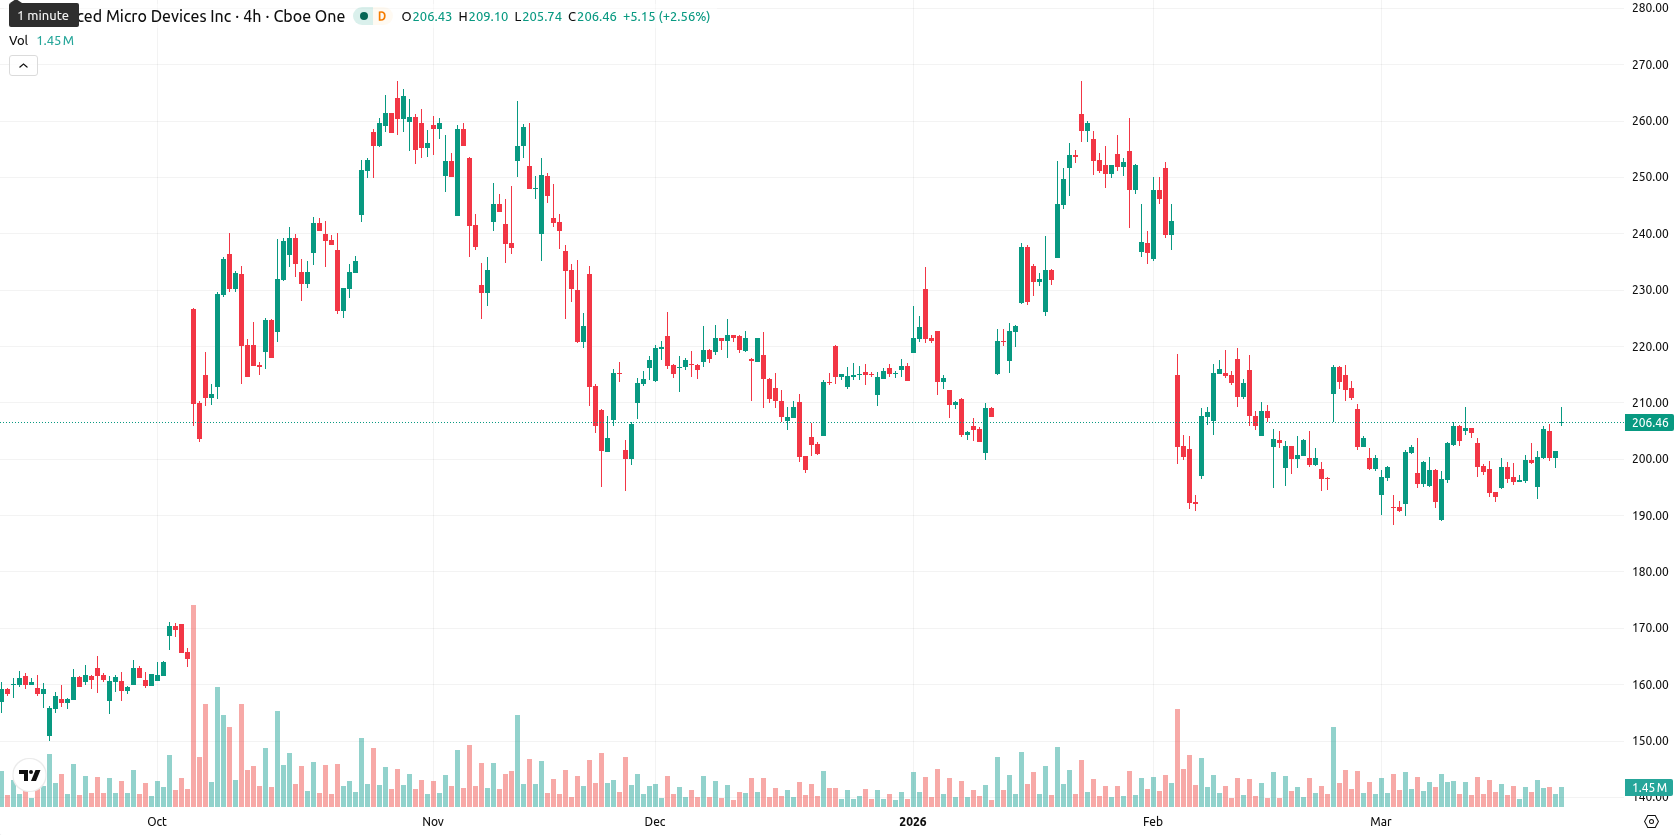
Advanced Micro Devices, Inc. (AMD) is trading at $206.90, showing a daily gain of 2.82%. The price is above the short-term SMA-20 at $200.47 but remains below the SMA-50 at $214.44, reflecting short-term bullishness within medium-term resistance. AMD is well above the SMA-200 at $192.97, supporting a positive long-term trend, with the Ichimoku Kijun level at $203.34 now serving as immediate support.
Highlights
- AMD trades near $206.90, showing short-term bullish momentum but facing medium-term resistance amid sustained long-term support.
- Technical indicators are mixed, with intraday signals overbought but overall trend momentum limited and showing exhaustion.
- Expected price action is sideways between $206 and $218 over the next week, with $203 as key support and $218 as resistance.
Mixed momentum as intraday strength contrasts with exhaustion signals
Momentum signals for AMD are mixed. The MACD on the daily chart indicates strong selling momentum, while the ADX remains neutral with low trend strength. The RSI is below 50, indicating selling pressure, and the Stoch RSI signals a strongly overbought condition, suggesting near-term exhaustion. CCI is neutral, BBP points to overbought territory dominated by buyers intraday, and the Awesome Oscillator is neutral without clear trend confirmation. AMD opened with a gap higher at $207.27 versus the previous close of $201.22, and price currently trades near the top of today's $205.93 – $208.22 range. Volatility is moderate, with price action showing persistent strength after the open. A divergence between intraday momentum and underlying trend signals is notable, as indicators flag both bullishness and signs of exhaustion.
Sideways outlook as overbought signals cap near-term upside
In the next five trading days, AMD is expected to move within a typical volatility band between $206.00 and $218.00. The probability of a price increase is moderate at 40%, but a further decrease remains more likely in the short term. The most probable scenario is a sideways move between $206 and $218 while overbought conditions are absorbed. Upside opens if buyers break above $208 – $210, triggering a potential test of $218, while any drop below $203 – $206 could expose the price to a retest of lower support near $203.34.
Earlier, analysts noted that AMD was in a period of mixed technical momentum with uncertainty regarding further direction. Current indicators reinforce this view, highlighting that attention to whether buyers can sustain momentum above the $210 threshold will be critical for identifying any renewed breakout potential.


-
 Afghanistan
-
 Albania
-
 Algeria
-
 Angola
-
 Argentina
-
 Armenia
-
 Australia
-
 Austria
-
 Azerbaijan
-
 Bahamas
-
 Bahrain
-
 Bangladesh
-
 Belarus
-
 Belgium
-
 Bolivia
-
 Botswana
-
 Brazil
-
 Brunei
-
 Bulgaria
-
 Cambodia
-
 Cameroon
-
 Canada
-
 Chile
Chile
-
 China
China
-
 Colombia
-
 Congo
Congo
-
 Costa Rica
-
 Cote d'Ivoire
-
 Croatia
-
 Cuba
Cuba
-
 Cyprus
-
 Czechia
-
 DR Congo
-
 Denmark
-
 Dominican Republic
-
 Ecuador
-
 Egypt
Egypt
-
 El Salvador
-
 Estonia
-
 Eswatini
-
 Ethiopia
-
 Finland
-
 France
-
 Georgia
-
 Germany
-
 Ghana
Ghana
-
 Greece
-
 Haiti
Haiti
-
 Hong Kong
-
 Hungary
-
 India
India
-
 Indonesia
-
 Iran, Islamic republic
-
 Iraq
Iraq
-
 Ireland
-
 Israel
-
 Italy
Italy
-
 Jamaica
-
 Japan
Japan
-
 Jordan
-
 Kazakhstan
-
 Kenya
Kenya
-
 Korea
Korea
-
 Kuwait
-
 Kyrgyzstan
-
 Laos
Laos
-
 Latvia
-
 Lebanon
-
 Lesotho
-
 Libya
Libya
-
 Lithuania
-
 Luxembourg
-
 Madagascar
-
 Malaysia
-
 Malta
Malta
-
 Mauritius
-
 Mexico
-
 Moldova
-
 Mongolia
-
 Montenegro
-
 Morocco
-
 Mozambique
-
 Myanmar
-
 Namibia
-
 Nepal
Nepal
-
 Netherlands
-
 New Zealand
-
 Nigeria
-
 North Macedonia
-
 Norway
-
 Oman
Oman
-
 Pakistan
-
 Palestine
-
 Panama
-
 Papua New Guinea
-
 Paraguay
-
 Peru
Peru
-
 Philippines
-
 Poland
-
 Portugal
-
 Puerto Rico
-
 Qatar
Qatar
-
 Reunion
-
 Romania
-
 Rwanda
-
 Saudi Arabia
-
 Serbia
-
 Singapore
-
 Slovakia
-
 Slovenia
-
 Somalia
-
 South Africa
-
 Spain
Spain
-
 Sri Lanka
-
 Sweden
-
 Switzerland
-
 Syria
Syria
-
 Taiwan
-
 Tajikistan
-
 Tanzania
-
 Thailand
-
 Trinidad and Tobago
-
 Tunisia
-
 Turkey
-
 UAE
UAE
-
 Uganda
-
 Ukraine
-
 United Kingdom
-
United States
-
 Uruguay
-
 Uzbekistan
-
 Venezuela
-
 Vietnam
-
 Yemen
Yemen
-
 Zambia
-
 Zimbabwe
- Forex
- Crypto
