
Intuit stock falls as bearish pressure persists despite strong revenue growth

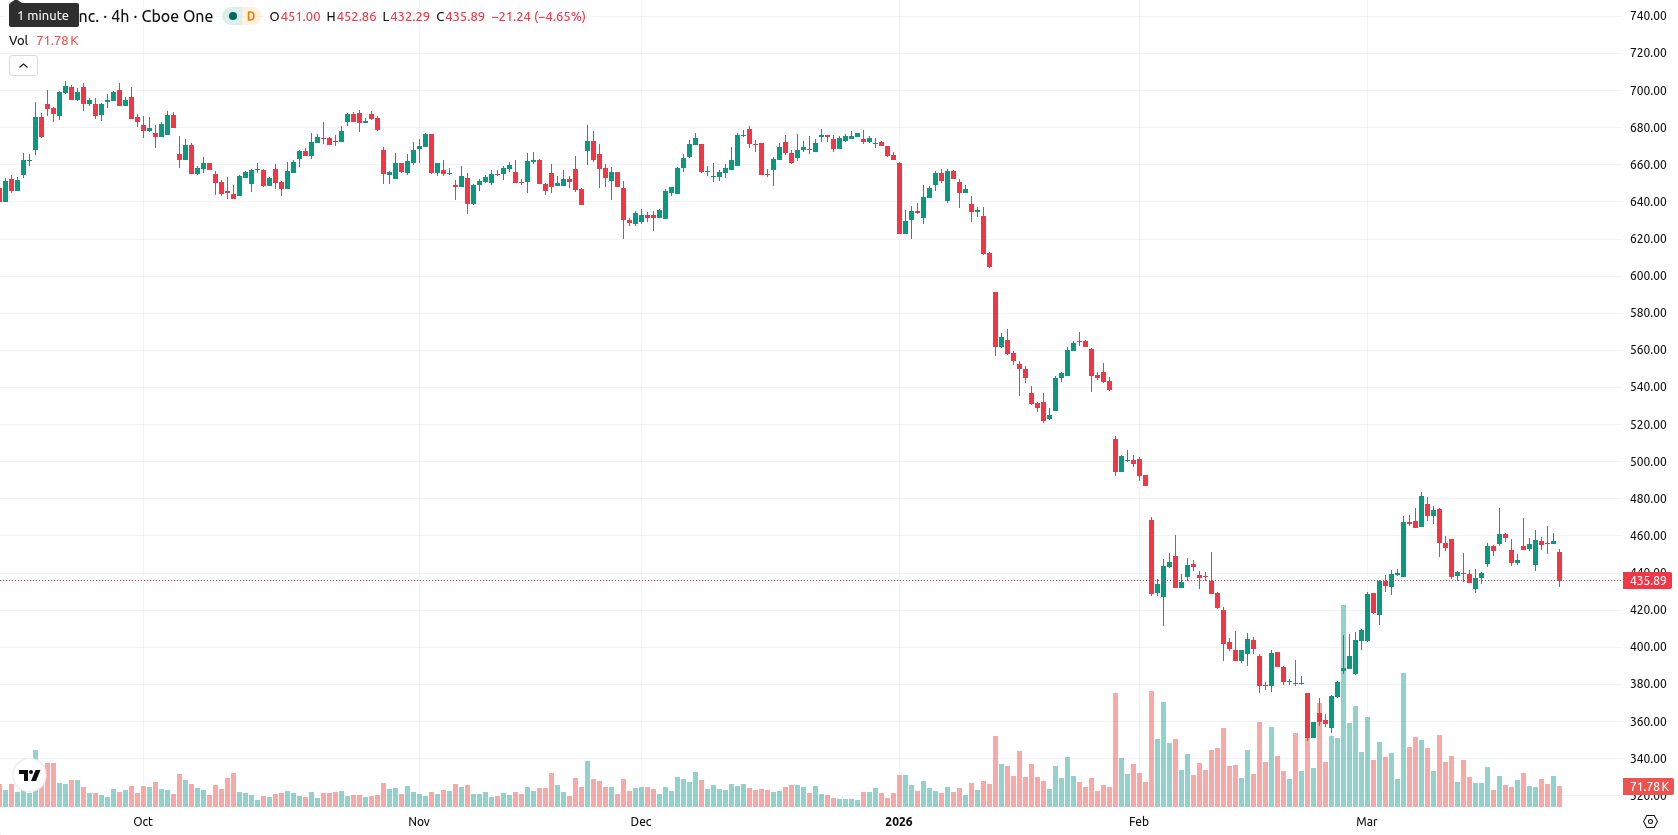
Intuit Inc. (INTU) is trading at $436.12, slightly below the SMA-20 of $437.68, and well under both the SMA-50 at $466.24 and the SMA-200 at $639.83. This positioning suggests mounting short- and medium-term bearish pressure, confirmed by long-term weakness, while the Ichimoku Kijun at $416.10 marks immediate resistance above the current price.
Highlights
- Intuit announced an accelerated share buyback and paused management stock sales, signaling increased confidence despite recent stock sales by Representative Gottheimer.
- The company delivered strong fundamentals with 17% revenue growth and an 81% gross profit margin over the past year.
- Technicals indicate mounting bearish pressure, with INTU trading below key averages and likely remaining rangebound between $425 and $450 amid continued volatility.
Share buybacks and insider sale contrast amid revenue growth and selling pressure
Intuit announced accelerated share buyback plans and a pause on pre-scheduled management stock sales. The company reported 17% revenue growth over the last twelve months and an 81% gross profit margin. Representative Josh Gottheimer disclosed the sale of between $1,001 and $15,000 of Intuit stock on February 20, as reported in a March 16 filing, though price action has remained under broader selling pressure.
Mixed momentum signals as sellers drive increased volatility
Momentum readings remain mixed: MACD is neutral on D1 but signals a sell on W1, and ADX indicates sellers have regained control in both timeframes. RSI at 53.07 and CCI at 55.94 suggest little sign of oversold conditions on D1, but Stoch RSI shows some intraday oversold signals. BBP forecasts an overbought stance on D1, even though sellers dominated intraday, as reflected by the sharp daily decline to near session lows (today’s range was $432.32–$450.32, daily loss of 4.64%). The session opened with a downside gap from $457.32 to $450.08, then saw strong volatility before continued downward pressure. This steep drop and volatility are generally consistent with weak momentum, though the mixed oscillator signals highlight a divergence.
Downside favored as volatility keeps INTU in narrow range
For the coming week, the expected range for INTU is $425–$450, a volatility band relative to current levels. The probability of a price increase is very low (less than 20%), with the downside scenario much more likely based on all major weekly indicators pointing to continued weakness. Baseline scenario: INTU remains rangebound between $425 and $450 as volatility persists. Bullish scenario: a rebound above $450 would require a shift in sentiment and clearing immediate resistance, while a break below $425 could expose INTU to additional losses toward lower support levels.
Earlier, analysts noted that despite strong fundamentals and aggressive buybacks Intuit continued to face persistent downside pressure amid mixed technical momentum. The current analysis reinforces this caution, underscoring that further weakness remains likely in the near term and that a decisive move below $425 could heighten downside risks for traders.


-
 Afghanistan
-
 Albania
-
 Algeria
-
 Angola
-
 Argentina
-
 Armenia
-
 Australia
-
 Austria
-
 Azerbaijan
-
 Bahamas
-
 Bahrain
-
 Bangladesh
-
 Belarus
-
 Belgium
-
 Bolivia
-
 Botswana
-
 Brazil
-
 Brunei
-
 Bulgaria
-
 Cambodia
-
 Cameroon
-
 Canada
-
 Chile
Chile
-
 China
China
-
 Colombia
-
 Congo
Congo
-
 Costa Rica
-
 Cote d'Ivoire
-
 Croatia
-
 Cuba
Cuba
-
 Cyprus
-
 Czechia
-
 DR Congo
-
 Denmark
-
 Dominican Republic
-
 Ecuador
-
 Egypt
Egypt
-
 El Salvador
-
 Estonia
-
 Eswatini
-
 Ethiopia
-
 Finland
-
 France
-
 Georgia
-
 Germany
-
 Ghana
Ghana
-
 Greece
-
 Haiti
Haiti
-
 Hong Kong
-
 Hungary
-
 India
India
-
 Indonesia
-
 Iran, Islamic republic
-
 Iraq
Iraq
-
 Ireland
-
 Israel
-
 Italy
Italy
-
 Jamaica
-
 Japan
Japan
-
 Jordan
-
 Kazakhstan
-
 Kenya
Kenya
-
 Korea
Korea
-
 Kuwait
-
 Kyrgyzstan
-
 Laos
Laos
-
 Latvia
-
 Lebanon
-
 Lesotho
-
 Libya
Libya
-
 Lithuania
-
 Luxembourg
-
 Madagascar
-
 Malaysia
-
 Malta
Malta
-
 Mauritius
-
 Mexico
-
 Moldova
-
 Mongolia
-
 Montenegro
-
 Morocco
-
 Mozambique
-
 Myanmar
-
 Namibia
-
 Nepal
Nepal
-
 Netherlands
-
 New Zealand
-
 Nigeria
-
 North Macedonia
-
 Norway
-
 Oman
Oman
-
 Pakistan
-
 Palestine
-
 Panama
-
 Papua New Guinea
-
 Paraguay
-
 Peru
Peru
-
 Philippines
-
 Poland
-
 Portugal
-
 Puerto Rico
-
 Qatar
Qatar
-
 Reunion
-
 Romania
-
 Rwanda
-
 Saudi Arabia
-
 Serbia
-
 Singapore
-
 Slovakia
-
 Slovenia
-
 Somalia
-
 South Africa
-
 Spain
Spain
-
 Sri Lanka
-
 Sweden
-
 Switzerland
-
 Syria
Syria
-
 Taiwan
-
 Tajikistan
-
 Tanzania
-
 Thailand
-
 Trinidad and Tobago
-
 Tunisia
-
 Turkey
-
 UAE
UAE
-
 Uganda
-
 Ukraine
-
 United Kingdom
-
United States
-
 Uruguay
-
 Uzbekistan
-
 Venezuela
-
 Vietnam
-
 Yemen
Yemen
-
 Zambia
-
 Zimbabwe
- Forex
- Crypto
