
-3.18% for NuCana stock as price stays pinned below key support levels

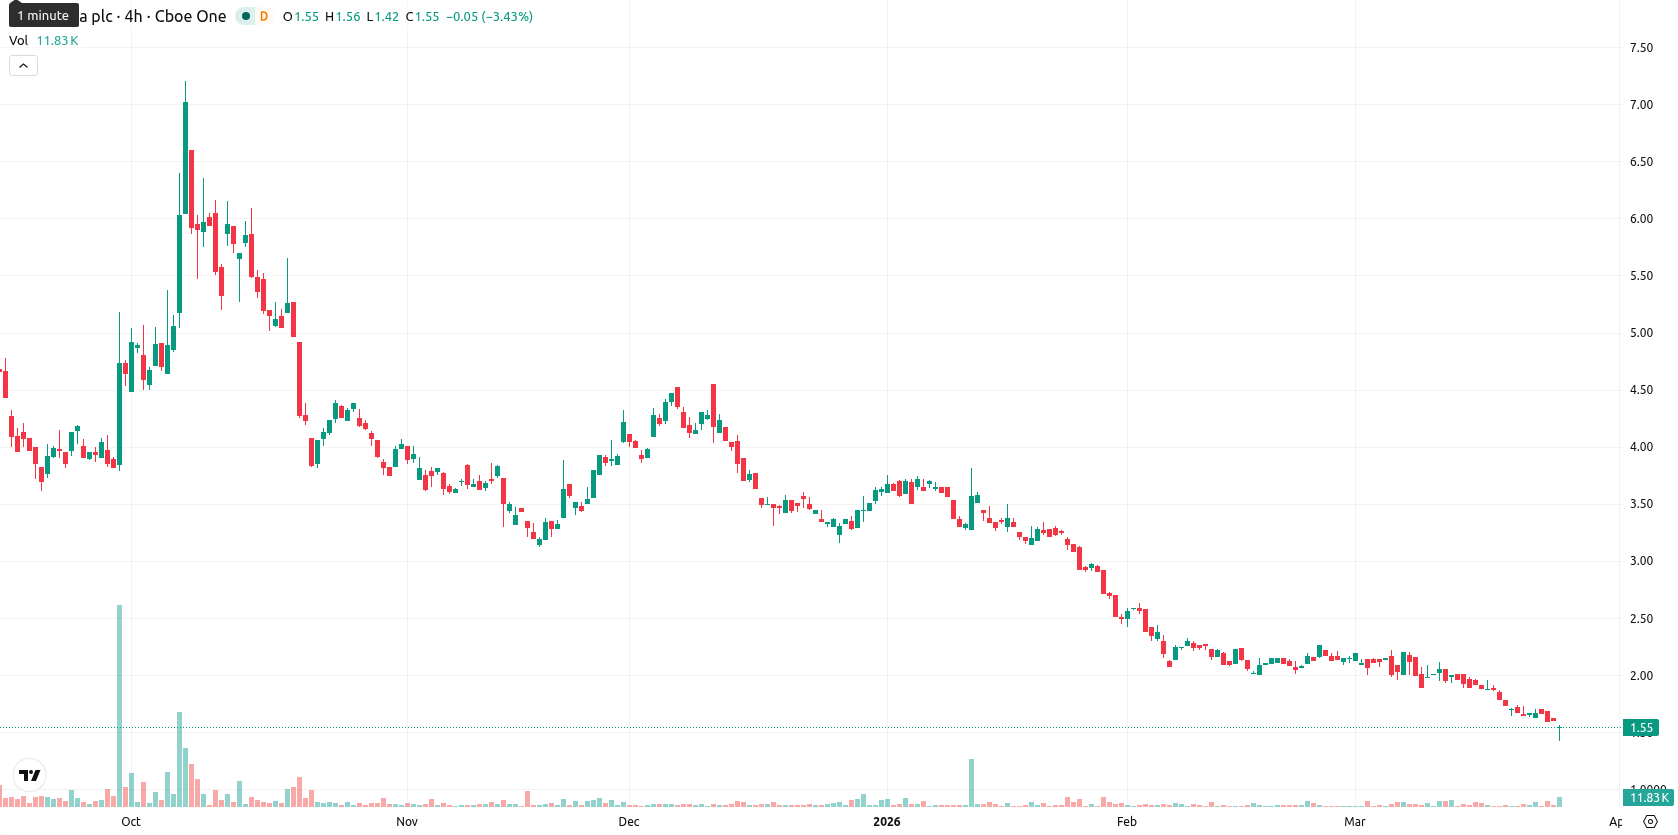
NuCana plc ADR (NCNA) is trading at $1.54, which marks a daily decline of 3.18%. The stock remains under downward pressure, positioned well below its SMA-20 ($1.95), SMA-50 ($2.36), and SMA-200 ($5.74) levels.
Highlights
- NCNA is trading well below key moving averages, indicating sustained bearish momentum across all time frames.
- Momentum and volatility indicators confirm a strong downward trend, with oversold signals but no imminent reversal.
- Short-term consolidation is likely between $1.49 and $1.55, with a break below $1.49 increasing downside risk.
Bearish trend confirmed as technical signals converge on oversold weakness
NCNA is trading at $1.54, which is below the SMA-20 ($1.95), SMA-50 ($2.36), and SMA-200 ($5.74). This positioning indicates persistent downward pressure across short, medium, and long-term trends, with the Ichimoku Kijun at $1.93 now acting as immediate resistance. Momentum indicators show prevailing bearishness: MACD is negative and signals a sell, while ADX at 34.23 confirms a strong downward trend. RSI (26.71), CCI (–152.39), and Stoch RSI (0.00) all signal oversold conditions, suggesting stretched downside but no reversal yet. BBP remains negative, highlighting continued seller dominance, and AO also supports the bearish trend. The stock opened at $1.55 following a previous close at $1.59, with no significant gap. Currently, the price is near the low of today’s range ($1.42–$1.57), reflecting high intraday volatility and notable pressure after the open. Intraday and momentum signals are aligned, confirming the bearish tone.
Downside risk favored as breakout scenarios hinge on resistance
The expected trading range for the next five sessions is $1.49 to $1.55. The probability of further price increases is very low (less than 20%), making downside continuation more likely. The baseline scenario is sideways consolidation between these support and resistance levels. A bullish scenario would emerge if the price decisively breaks above $1.93, while renewed downside could develop if levels below $1.49 fail to hold.
Earlier, analysts noted that NuCana was contending with persistent bearish momentum and a dominant seller bias. The current technical environment not only confirms this ongoing weakness but also highlights $1.49 as the key support level to monitor for any potential renewed downside acceleration.


Latest NuCana News


-
 Afghanistan
-
 Albania
-
 Algeria
-
 Angola
-
 Argentina
-
 Armenia
-
 Australia
-
 Austria
-
 Azerbaijan
-
 Bahamas
-
 Bahrain
-
 Bangladesh
-
 Belarus
-
 Belgium
-
 Bolivia
-
 Botswana
-
 Brazil
-
 Brunei
-
 Bulgaria
-
 Cambodia
-
 Cameroon
-
 Canada
-
 Chile
Chile
-
 China
China
-
 Colombia
-
 Congo
Congo
-
 Costa Rica
-
 Cote d'Ivoire
-
 Croatia
-
 Cuba
Cuba
-
 Cyprus
-
 Czechia
-
 DR Congo
-
 Denmark
-
 Dominican Republic
-
 Ecuador
-
 Egypt
Egypt
-
 El Salvador
-
 Estonia
-
 Eswatini
-
 Ethiopia
-
 Finland
-
 France
-
 Georgia
-
 Germany
-
 Ghana
Ghana
-
 Greece
-
 Haiti
Haiti
-
 Hong Kong
-
 Hungary
-
 India
India
-
 Indonesia
-
 Iran, Islamic republic
-
 Iraq
Iraq
-
 Ireland
-
 Israel
-
 Italy
Italy
-
 Jamaica
-
 Japan
Japan
-
 Jordan
-
 Kazakhstan
-
 Kenya
Kenya
-
 Korea
Korea
-
 Kuwait
-
 Kyrgyzstan
-
 Laos
Laos
-
 Latvia
-
 Lebanon
-
 Lesotho
-
 Libya
Libya
-
 Lithuania
-
 Luxembourg
-
 Madagascar
-
 Malaysia
-
 Malta
Malta
-
 Mauritius
-
 Mexico
-
 Moldova
-
 Mongolia
-
 Montenegro
-
 Morocco
-
 Mozambique
-
 Myanmar
-
 Namibia
-
 Nepal
Nepal
-
 Netherlands
-
 New Zealand
-
 Nigeria
-
 North Macedonia
-
 Norway
-
 Oman
Oman
-
 Pakistan
-
 Palestine
-
 Panama
-
 Papua New Guinea
-
 Paraguay
-
 Peru
Peru
-
 Philippines
-
 Poland
-
 Portugal
-
 Puerto Rico
-
 Qatar
Qatar
-
 Reunion
-
 Romania
-
 Rwanda
-
 Saudi Arabia
-
 Serbia
-
 Singapore
-
 Slovakia
-
 Slovenia
-
 Somalia
-
 South Africa
-
 Spain
Spain
-
 Sri Lanka
-
 Sweden
-
 Switzerland
-
 Syria
Syria
-
 Taiwan
-
 Tajikistan
-
 Tanzania
-
 Thailand
-
 Trinidad and Tobago
-
 Tunisia
-
 Turkey
-
 UAE
UAE
-
 Uganda
-
 Ukraine
-
 United Kingdom
-
United States
-
 Uruguay
-
 Uzbekistan
-
 Venezuela
-
 Vietnam
-
 Yemen
Yemen
-
 Zambia
-
 Zimbabwe
- Forex
- Crypto
