
Intuit stock price forecast: $385–$415 range in focus as INTU loses 3.27%

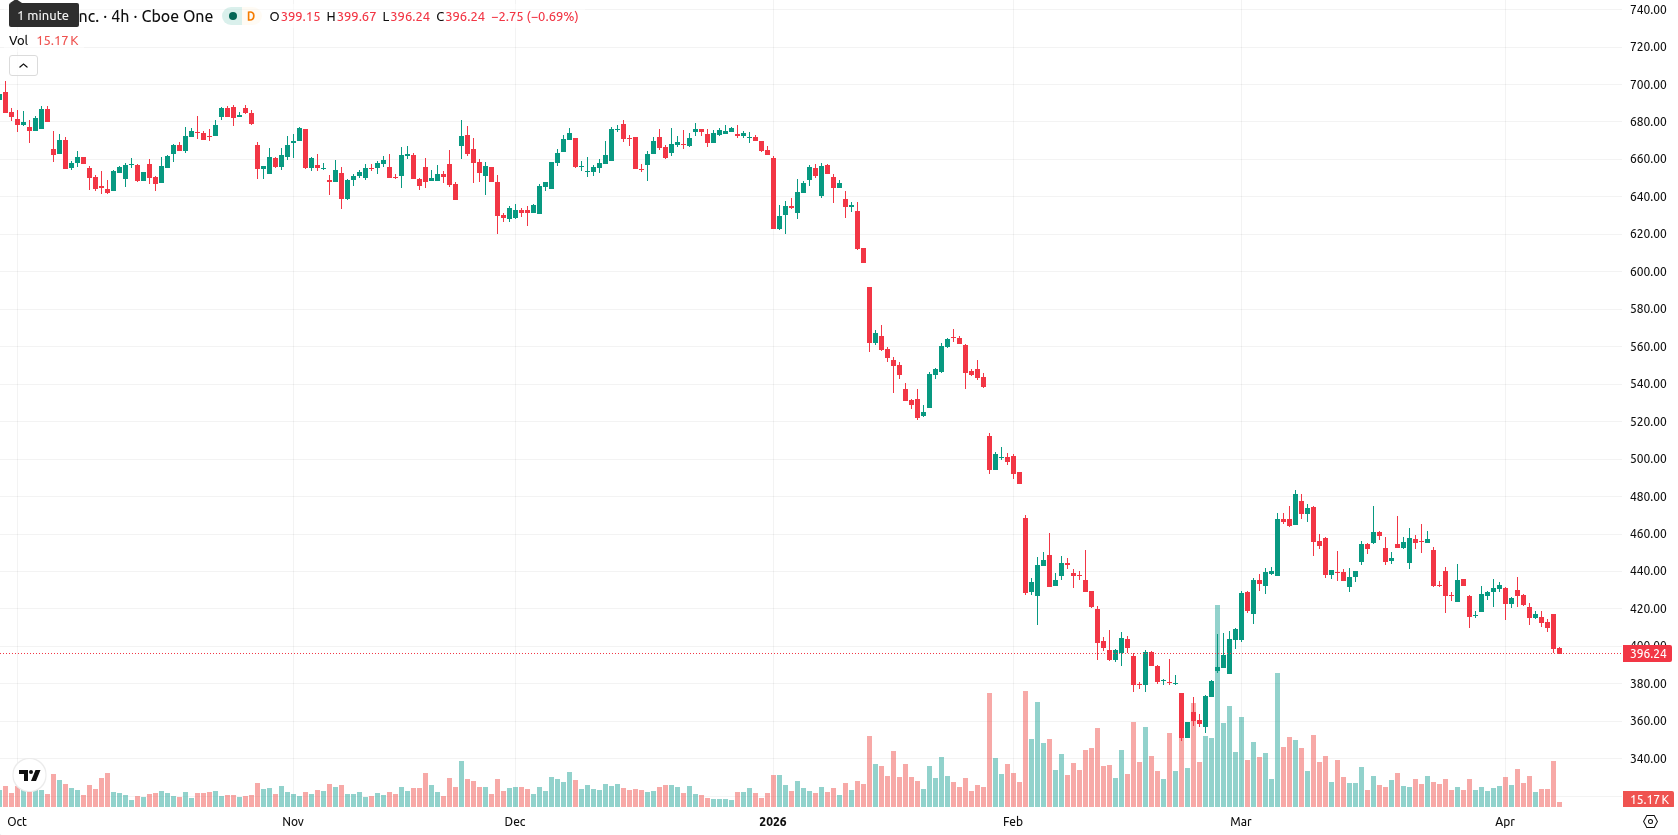
Intuit Inc. (INTU) is trading at $396.57, down 3.27% on the day. The stock remains well below its SMA-20 ($437.07), SMA-50 ($436.76), and SMA-200 ($622.88), indicating ongoing selling pressure across multiple timeframes.
Highlights
- Intuit announced a quarterly dividend of $1.20 per share, payable April 17, 2026, signaling ongoing capital returns.
- Vest Financial, LLC increased its stake in Intuit to 12,562 shares, now worth approximately $8.32 million.
- Intuit trades below critical moving averages with persistent bearish momentum, and is likely to fluctuate between $385 and $415 over the next week.
Dividend declaration and institutional buying as Intuit unveils education push
Intuit declared a quarterly dividend of $1.20 per share, with a record date of April 9, 2026 and payment scheduled for April 17, 2026. The company also introduced a new financial literacy program, Intuit for Education, alongside the Intuit Hour of Finance Challenge. Vest Financial, LLC increased its stake in Intuit by purchasing 3,777 additional shares, bringing its total holdings to 12,562 shares valued at approximately $8.32 million.
Bearish momentum persists with oversold signals and strong resistance overhead
The current price of Intuit ($396.57) is trading well below the SMA-20 ($437.07), SMA-50 ($436.76), and SMA-200 ($622.88), indicating clear short-, medium-, and long-term pressure from sellers. The Ichimoku Kijun on D1 stands at $442.32, positioning it as immediate resistance above the market.
Momentum remains firmly negative, as both MACD and ADX show persistent sell signals, confirming a strong bearish trend. RSI and CCI indicate oversold readings, while Stoch RSI also signals oversold conditions, highlighting heightened downside pressure. BBP's deeply negative value confirms clear seller dominance intraday. AO also supports the prevailing downtrend. The price gapped up at the open but reversed sharply lower, with the last trade near the day's low and volatility elevated. There is marked pressure after the open, and intraday losses align with the momentum indicators' bearish outlook.
Further losses likely as low probability assigned to near-term rebound
Looking ahead, the expected 5-day range is adjusted to $385 – $415, fitting with typical volatility for a blue-chip like Intuit. The probability of a price increase is very low (less than 20%), so a further decline is much more likely. The baseline scenario is continued sideways movement between $385 and $415. In a bullish case, a sustained move above $415 could target quick resistance near $426, but momentum does not support this path. Conversely, a bearish scenario would unfold if the price breaks below $385, exposing $375 or lower. The dominant trend outlook across daily and weekly indicators remains negative, making any sustained recovery unlikely in the immediate term.
Earlier, analysts noted that despite solid fundamentals, Intuit faced persistent downside pressure as momentum and technical signals indicated a prevailing bearish bias. The current environment not only reinforces this negative outlook with intensified selling and oversold technicals, but also raises the importance of monitoring whether the $385 level holds, as a breakdown here could accelerate downside risk in the coming sessions.


-
 Afghanistan
-
 Albania
-
 Algeria
-
 Angola
-
 Argentina
-
 Armenia
-
 Australia
-
 Austria
-
 Azerbaijan
-
 Bahamas
-
 Bahrain
-
 Bangladesh
-
 Belarus
-
 Belgium
-
 Bolivia
-
 Botswana
-
 Brazil
-
 Brunei
-
 Bulgaria
-
 Cambodia
-
 Cameroon
-
 Canada
-
 Chile
Chile
-
 China
China
-
 Colombia
-
 Congo
Congo
-
 Costa Rica
-
 Cote d'Ivoire
-
 Croatia
-
 Cuba
Cuba
-
 Cyprus
-
 Czechia
-
 DR Congo
-
 Denmark
-
 Dominican Republic
-
 Ecuador
-
 Egypt
Egypt
-
 El Salvador
-
 Estonia
-
 Eswatini
-
 Ethiopia
-
 Finland
-
 France
-
 Georgia
-
 Germany
-
 Ghana
Ghana
-
 Greece
-
 Haiti
Haiti
-
 Hong Kong
-
 Hungary
-
 India
India
-
 Indonesia
-
 Iran, Islamic republic
-
 Iraq
Iraq
-
 Ireland
-
 Israel
-
 Italy
Italy
-
 Jamaica
-
 Japan
Japan
-
 Jordan
-
 Kazakhstan
-
 Kenya
Kenya
-
 Korea
Korea
-
 Kuwait
-
 Kyrgyzstan
-
 Laos
Laos
-
 Latvia
-
 Lebanon
-
 Lesotho
-
 Libya
Libya
-
 Lithuania
-
 Luxembourg
-
 Madagascar
-
 Malaysia
-
 Malta
Malta
-
 Mauritius
-
 Mexico
-
 Moldova
-
 Mongolia
-
 Montenegro
-
 Morocco
-
 Mozambique
-
 Myanmar
-
 Namibia
-
 Nepal
Nepal
-
 Netherlands
-
 New Zealand
-
 Nigeria
-
 North Macedonia
-
 Norway
-
 Oman
Oman
-
 Pakistan
-
 Palestine
-
 Panama
-
 Papua New Guinea
-
 Paraguay
-
 Peru
Peru
-
 Philippines
-
 Poland
-
 Portugal
-
 Puerto Rico
-
 Qatar
Qatar
-
 Reunion
-
 Romania
-
 Rwanda
-
 Saudi Arabia
-
 Serbia
-
 Singapore
-
 Slovakia
-
 Slovenia
-
 Somalia
-
 South Africa
-
 Spain
Spain
-
 Sri Lanka
-
 Sweden
-
 Switzerland
-
 Syria
Syria
-
 Taiwan
-
 Tajikistan
-
 Tanzania
-
 Thailand
-
 Trinidad and Tobago
-
 Tunisia
-
 Turkey
-
 UAE
UAE
-
 Uganda
-
 Ukraine
-
 United Kingdom
-
United States
-
 Uruguay
-
 Uzbekistan
-
 Venezuela
-
 Vietnam
-
 Yemen
Yemen
-
 Zambia
-
 Zimbabwe
- Forex
- Crypto
