
META stock consolidates near $627 as technical indicators signal seller momentum: weekly outlook

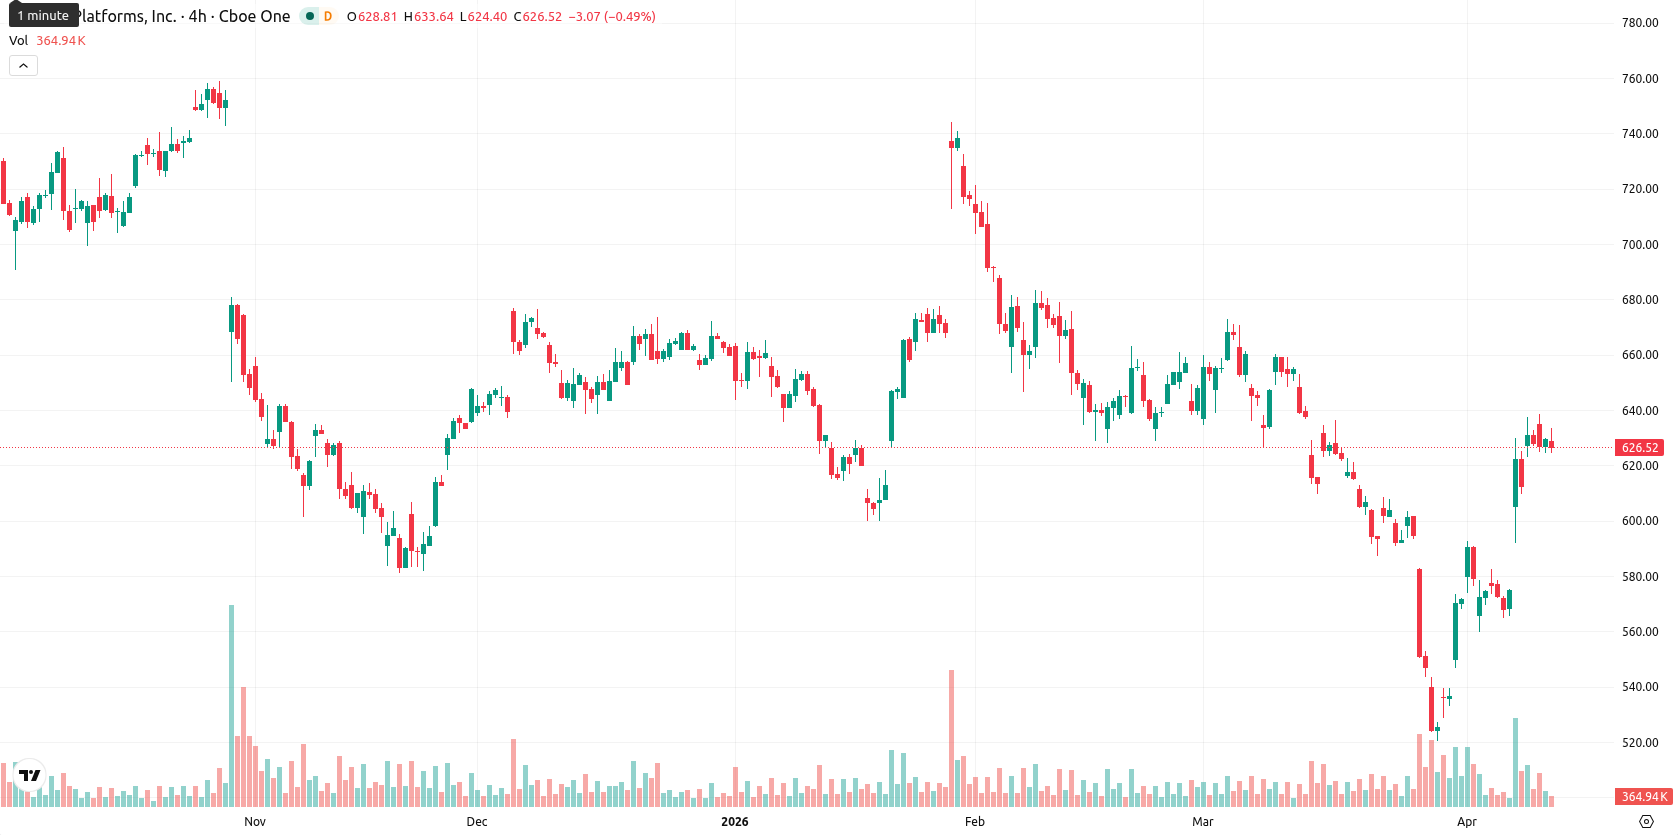
Meta Platforms, Inc. (META, formerly Facebook) is currently trading at $627.31 after falling $2.40 (0.38%) over the past week. On the weekly chart, META sits below the MA-20 at $638.80 and MA-50 at $674.09, but remains well above the MA-200 at $442.25, signaling medium-term pressure from sellers while the long-term trend structure is still supported by the elevated price over the MA-200.
Highlights
- META trades in a consolidation phase between $605 and $648, reflecting sustained volatility and diminished buyer momentum.
- Technical momentum indicators are broadly bearish or neutral, signaling mounting selling pressure near resistance and a low probability of upside.
- A break above $648 may trigger renewed upward momentum, while a drop below $605 would indicate further downside risk for META.
Legal headwinds and AI innovation shape institutional positioning this week
Meta continues to face significant legal and regulatory risk, appealing court verdicts totaling nearly $380 million related to allegations that its platforms harmed minors and preparing to stand trial in Massachusetts over the design of alleged addictive features for teens. Corporate developments include the launch of the artificial intelligence model Muse Spark, underlining the company's commitment to innovation and expansion. Recent filings show institutional investors adjusting positions, with Family Legacy Financial Solutions LLC increasing its holdings and Braun Stacey Associates Inc. reducing theirs, while institutional ownership stands at about 80%.
Bearish to neutral momentum prevails as technical indicators weaken
On the weekly timeframe, technical indicators for META continue to reflect a bearish to neutral momentum profile. The stock is below both its MA-20 and MA-50, with the MACD and ADX indicating weak or neutral momentum, while the RSI, Commodity Channel Index, and Stochastic RSI produce selling or neutral signals. Overbought conditions are signaled by Stochastic RSI and Bull/Bear Power, suggesting buyers have lost dominance and that selling pressure is re-emerging near resistance. Support is expected around $605.00, with resistance at $648.00, and weekly volatility remains high at 12.98%.
Sideways bias likely amid seller control and persistent volatility next week
For the next five trading days, META is likely to consolidate between $605.00 and $648.00 as buyers lack momentum and volatility persists. The low probability of further upside (less than 20%) suggests sellers are in control, supporting a baseline scenario of sideways to mildly bearish action. A bullish outcome would require a break above $648.00, renewing upward momentum if sentiment improves, while a move below $605.00 would indicate scope for further downside as bears gain control on the weekly chart.
Earlier, analysts noted that Meta displayed mixed momentum, with bullish signs limited by persistent long-term seller pressure and emerging legal risks. The current weekly setup not only reinforces these concerns but also highlights renewed selling as buyers lose control, making sustained movement above $648.00 the key threshold for any reversal in sentiment.


Latest META News


-
 Afghanistan
-
 Albania
-
 Algeria
-
 Angola
-
 Argentina
-
 Armenia
-
 Australia
-
 Austria
-
 Azerbaijan
-
 Bahamas
-
 Bahrain
-
 Bangladesh
-
 Belarus
-
 Belgium
-
 Bolivia
-
 Botswana
-
 Brazil
-
 Brunei
-
 Bulgaria
-
 Cambodia
-
 Cameroon
-
 Canada
-
 Chile
Chile
-
 China
China
-
 Colombia
-
 Congo
Congo
-
 Costa Rica
-
 Cote d'Ivoire
-
 Croatia
-
 Cuba
Cuba
-
 Cyprus
-
 Czechia
-
 DR Congo
-
 Denmark
-
 Dominican Republic
-
 Ecuador
-
 Egypt
Egypt
-
 El Salvador
-
 Estonia
-
 Eswatini
-
 Ethiopia
-
 Finland
-
 France
-
 Georgia
-
 Germany
-
 Ghana
Ghana
-
 Greece
-
 Haiti
Haiti
-
 Hong Kong
-
 Hungary
-
 India
India
-
 Indonesia
-
 Iran, Islamic republic
-
 Iraq
Iraq
-
 Ireland
-
 Israel
-
 Italy
Italy
-
 Jamaica
-
 Japan
Japan
-
 Jordan
-
 Kazakhstan
-
 Kenya
Kenya
-
 Korea
Korea
-
 Kuwait
-
 Kyrgyzstan
-
 Laos
Laos
-
 Latvia
-
 Lebanon
-
 Lesotho
-
 Libya
Libya
-
 Lithuania
-
 Luxembourg
-
 Madagascar
-
 Malaysia
-
 Malta
Malta
-
 Mauritius
-
 Mexico
-
 Moldova
-
 Mongolia
-
 Montenegro
-
 Morocco
-
 Mozambique
-
 Myanmar
-
 Namibia
-
 Nepal
Nepal
-
 Netherlands
-
 New Zealand
-
 Nigeria
-
 North Macedonia
-
 Norway
-
 Oman
Oman
-
 Pakistan
-
 Palestine
-
 Panama
-
 Papua New Guinea
-
 Paraguay
-
 Peru
Peru
-
 Philippines
-
 Poland
-
 Portugal
-
 Puerto Rico
-
 Qatar
Qatar
-
 Reunion
-
 Romania
-
 Rwanda
-
 Saudi Arabia
-
 Serbia
-
 Singapore
-
 Slovakia
-
 Slovenia
-
 Somalia
-
 South Africa
-
 Spain
Spain
-
 Sri Lanka
-
 Sweden
-
 Switzerland
-
 Syria
Syria
-
 Taiwan
-
 Tajikistan
-
 Tanzania
-
 Thailand
-
 Trinidad and Tobago
-
 Tunisia
-
 Turkey
-
 UAE
UAE
-
 Uganda
-
 Ukraine
-
 United Kingdom
-
United States
-
 Uruguay
-
 Uzbekistan
-
 Venezuela
-
 Vietnam
-
 Yemen
Yemen
-
 Zambia
-
 Zimbabwe
- Forex
- Crypto
