
AST SpaceMobile stock slides as launch timeline moves to April 2026

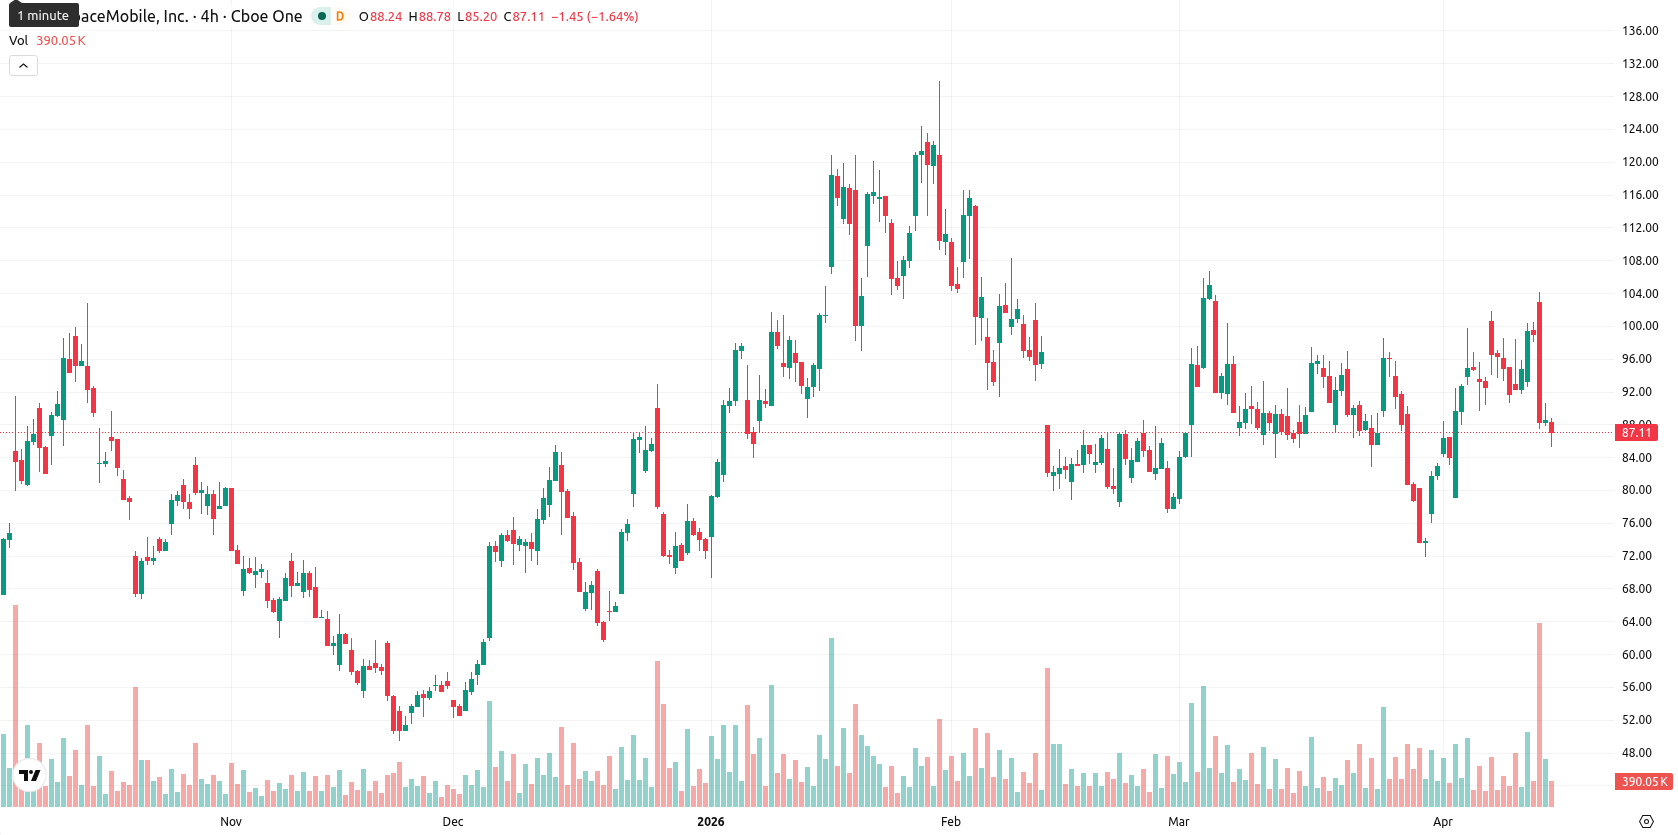
AST SpaceMobile Inc. (ASTS) is trading at $86.83, positioned below both the SMA-20 ($89.98) and SMA-50 ($90.51), but well above the SMA-200 ($71.70). This setup signals continued short- and medium-term downside pressure relative to key averages, while the longer-term structure remains constructive; immediate resistance is seen at the Ichimoku Kijun level of $87.49.
Highlights
- AST SpaceMobile reported fourth-quarter 2025 revenue of $70.9 million, surpassing analyst estimates by approximately 30% year-over-year.
- Initial commercial launch is delayed to at least April 2026, with 45–60 satellites targeted by year-end 2026.
- Shares face persistent short-term selling pressure, but the long-term outlook is bullish with an 82% probability of trading between $82.00 and $92.00 next week.
Upside earnings surprise as launch delays and buying shape sentiment
AST SpaceMobile recently reported fourth-quarter 2025 revenue of $70.9 million, representing a significant year-over-year increase and exceeding analyst expectations by approximately 30%. The company disclosed that its initial commercial launch is now scheduled for no earlier than April 10, 2026, and it continues to target the deployment of 45–60 satellites by the end of 2026. Additionally, Capelight Capital Asset Management LP acquired 18,000 shares of AST SpaceMobile during the fourth quarter. The timing for the BlueBird 7 mission has been shifted, with launch now set for April 16 as part of the upcoming New Glenn-3 mission, though price action has remained under broader selling pressure.
Momentum divergence as mixed signals counter modest daily gains
Technically, momentum signals for ASTS are mixed. MACD on the daily chart points to underlying buy interest, while a low ADX (11.25) highlights weak short-term trend strength. Both Stoch RSI and RSI are flashing sell signals, supported by overbought readings on BBP, which still indicates buyer dominance. The price ended the session closer to lows after moderate volatility, following a move down of nearly 2%, and the lack of an opening gap points to intraday pressure after the open; this aligns with weak short-term signals but runs contrary to the modest daily MACD bias.
Bullish probability rises amid elevated volatility and defined breakout levels
For the coming week, ASTS is expected to trade between $82.00 and $92.00, a typical volatility band relative to current levels and the prevailing trend. The probability of a price increase is very high, as all major weekly indicators are biased bullish, making a decline less likely. Baseline expectations are for continued sideways movement between immediate resistance and recent lows, with a bullish breakout scenario above $87.49 targeting $92.00, and a bearish scenario possible if prices fall below $85.50, aiming for the lower end of the projected range.
Earlier, analysts noted that AST SpaceMobile exhibited resilient long-term momentum despite short-term selling pressure. The latest signals point to a moderating trend with mixed momentum and shifting launch timelines, highlighting $87.49 as a key resistance level to monitor for confirmation of renewed bullish momentum in the sessions ahead.


Latest AST SpaceMobile News


-
 Afghanistan
-
 Albania
-
 Algeria
-
 Angola
-
 Argentina
-
 Armenia
-
 Australia
-
 Austria
-
 Azerbaijan
-
 Bahamas
-
 Bahrain
-
 Bangladesh
-
 Belarus
-
 Belgium
-
 Bolivia
-
 Botswana
-
 Brazil
-
 Brunei
-
 Bulgaria
-
 Cambodia
-
 Cameroon
-
 Canada
-
 Chile
Chile
-
 China
China
-
 Colombia
-
 Congo
Congo
-
 Costa Rica
-
 Cote d'Ivoire
-
 Croatia
-
 Cuba
Cuba
-
 Cyprus
-
 Czechia
-
 DR Congo
-
 Denmark
-
 Dominican Republic
-
 Ecuador
-
 Egypt
Egypt
-
 El Salvador
-
 Estonia
-
 Eswatini
-
 Ethiopia
-
 Finland
-
 France
-
 Georgia
-
 Germany
-
 Ghana
Ghana
-
 Greece
-
 Haiti
Haiti
-
 Hong Kong
-
 Hungary
-
 India
India
-
 Indonesia
-
 Iran, Islamic republic
-
 Iraq
Iraq
-
 Ireland
-
 Israel
-
 Italy
Italy
-
 Jamaica
-
 Japan
Japan
-
 Jordan
-
 Kazakhstan
-
 Kenya
Kenya
-
 Korea
Korea
-
 Kuwait
-
 Kyrgyzstan
-
 Laos
Laos
-
 Latvia
-
 Lebanon
-
 Lesotho
-
 Libya
Libya
-
 Lithuania
-
 Luxembourg
-
 Madagascar
-
 Malaysia
-
 Malta
Malta
-
 Mauritius
-
 Mexico
-
 Moldova
-
 Mongolia
-
 Montenegro
-
 Morocco
-
 Mozambique
-
 Myanmar
-
 Namibia
-
 Nepal
Nepal
-
 Netherlands
-
 New Zealand
-
 Nigeria
-
 North Macedonia
-
 Norway
-
 Oman
Oman
-
 Pakistan
-
 Palestine
-
 Panama
-
 Papua New Guinea
-
 Paraguay
-
 Peru
Peru
-
 Philippines
-
 Poland
-
 Portugal
-
 Puerto Rico
-
 Qatar
Qatar
-
 Reunion
-
 Romania
-
 Rwanda
-
 Saudi Arabia
-
 Serbia
-
 Singapore
-
 Slovakia
-
 Slovenia
-
 Somalia
-
 South Africa
-
 Spain
Spain
-
 Sri Lanka
-
 Sweden
-
 Switzerland
-
 Syria
Syria
-
 Taiwan
-
 Tajikistan
-
 Tanzania
-
 Thailand
-
 Trinidad and Tobago
-
 Tunisia
-
 Turkey
-
 UAE
UAE
-
 Uganda
-
 Ukraine
-
 United Kingdom
-
United States
-
 Uruguay
-
 Uzbekistan
-
 Venezuela
-
 Vietnam
-
 Yemen
Yemen
-
 Zambia
-
 Zimbabwe
- Forex
- Crypto
