
Kimberly-Clark stock price forecast: $100.50 resistance as KMB trades sideways

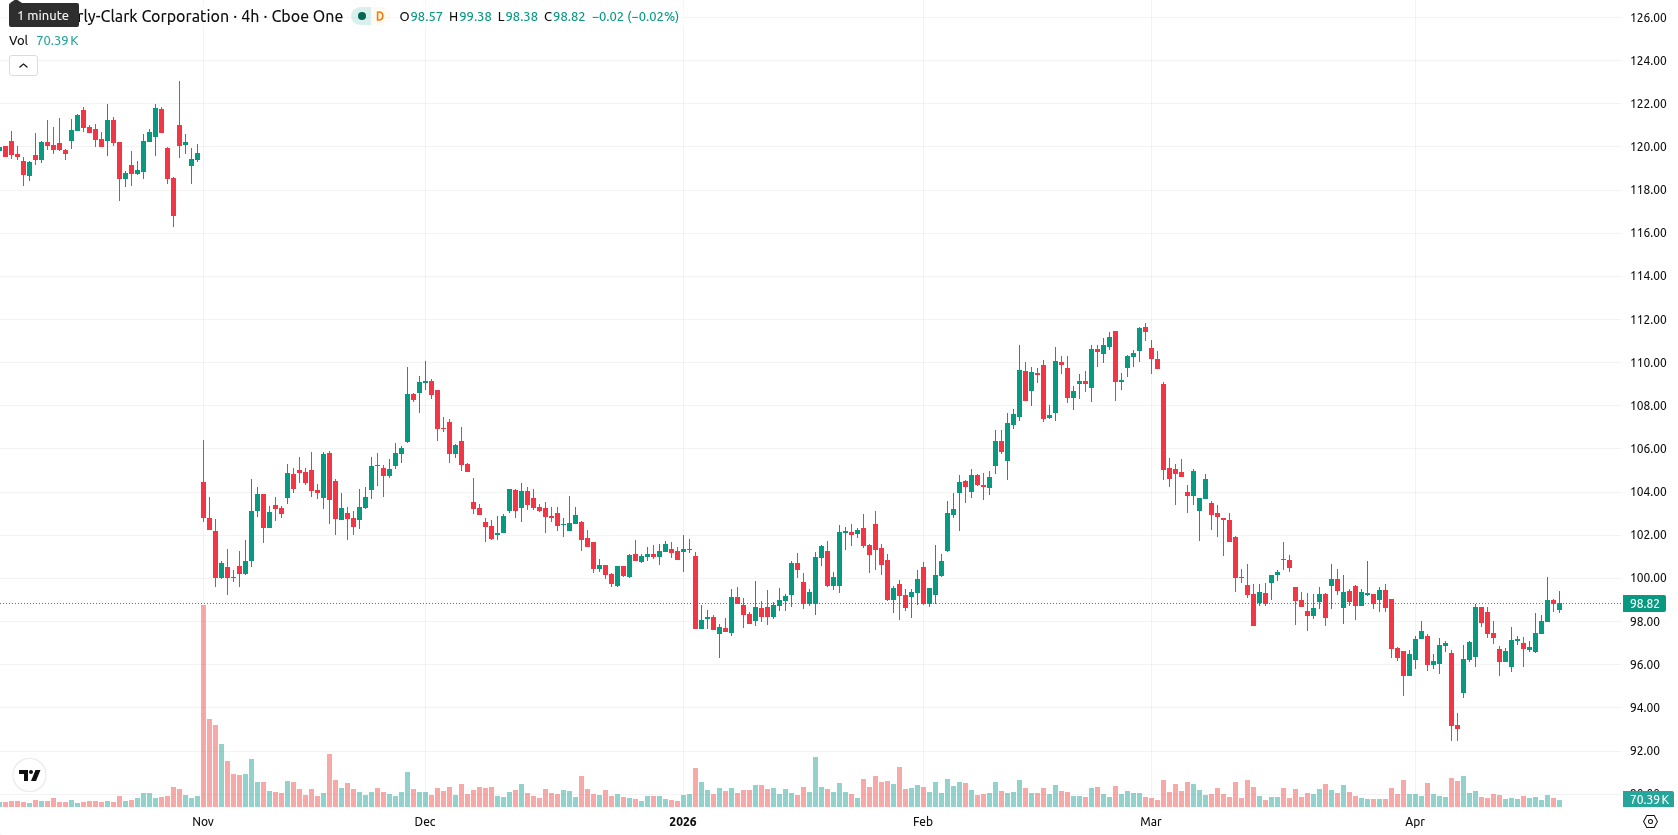
Kimberly-Clark Corporation (KMB) is trading at $99.18, posting a daily gain of 0.34%. The price is sitting above its key short-term moving average, but remains below medium- and long-term averages.
Highlights
- Kimberly-Clark unveiled a new global leadership structure ahead of its Kenvue integration, aiming for improved efficiency and growth post-acquisition.
- North American operations remain resilient on strong personal care and tissue demand and effective price management despite softer tissue volumes.
- KMB trades in a narrow $98.00–$100.50 band with short-term buying exhaustion and a higher risk of price pullback in the coming week.
Leadership shift and fund flows as Kenvue integration drives sentiment
On April 20, 2026, Kimberly-Clark detailed a new global leadership structure as it prepares to integrate with Kenvue, aiming to improve operational efficiency and support growth. The company confirmed its post-acquisition leadership team ahead of the planned closing of the Kenvue transaction in the second half of 2026, contingent on regulatory approval. Kimberly-Clark’s North American segment remains resilient due to solid demand for personal care and tissue products and effective pricing actions, although there is some softness in tissue volumes. Recent disclosures also show that Godsey & Gibb Inc. significantly reduced its position in KMB while Lorne Steinberg Wealth Management Inc. acquired a new stake.
Mixed momentum as resistance limits gains and overbought signals emerge
The price is above the MA-20 ($97.48), while remaining below the MA-50 ($102.19) and MA-200 ($112.74). The Ichimoku Kijun is at $97.06, providing immediate support, with today’s trading held between $98.39 and $99.35. Daily MACD indicates strong bearishness, the ADX points to weak trend strength, and the RSI is neutral-to-positive at 50.65. CCI sits in buy territory, Stoch RSI and BBP are both overbought, and the Awesome Oscillator is inconclusive, together signaling recent surges in buying activity but also the risk of near-term exhaustion.
Sideways action likely unless breakout over resistance attracts buyers
Over the next five trading days, the typical volatility band is likely to be between $98.00 and $100.50. Price is expected to fluctuate sideways near current levels unless a break above $100.50 draws in momentum buyers, opening the potential for a higher move. If support at $98.00 fails, sellers could regain control, increasing the possibility of a retest of recent lows.


Latest Kimberly-Clark News


-
 Afghanistan
-
 Albania
-
 Algeria
-
 Angola
-
 Argentina
-
 Armenia
-
 Australia
-
 Austria
-
 Azerbaijan
-
 Bahamas
-
 Bahrain
-
 Bangladesh
-
 Belarus
-
 Belgium
-
 Bolivia
-
 Botswana
-
 Brazil
-
 Brunei
-
 Bulgaria
-
 Cambodia
-
 Cameroon
-
 Canada
-
 Chile
Chile
-
 China
China
-
 Colombia
-
 Congo
Congo
-
 Costa Rica
-
 Cote d'Ivoire
-
 Croatia
-
 Cuba
Cuba
-
 Cyprus
-
 Czechia
-
 DR Congo
-
 Denmark
-
 Dominican Republic
-
 Ecuador
-
 Egypt
Egypt
-
 El Salvador
-
 Estonia
-
 Eswatini
-
 Ethiopia
-
 Finland
-
 France
-
 Georgia
-
 Germany
-
 Ghana
Ghana
-
 Greece
-
 Haiti
Haiti
-
 Hong Kong
-
 Hungary
-
 India
India
-
 Indonesia
-
 Iran, Islamic republic
-
 Iraq
Iraq
-
 Ireland
-
 Israel
-
 Italy
Italy
-
 Jamaica
-
 Japan
Japan
-
 Jordan
-
 Kazakhstan
-
 Kenya
Kenya
-
 Korea
Korea
-
 Kuwait
-
 Kyrgyzstan
-
 Laos
Laos
-
 Latvia
-
 Lebanon
-
 Lesotho
-
 Libya
Libya
-
 Lithuania
-
 Luxembourg
-
 Madagascar
-
 Malaysia
-
 Malta
Malta
-
 Mauritius
-
 Mexico
-
 Moldova
-
 Mongolia
-
 Montenegro
-
 Morocco
-
 Mozambique
-
 Myanmar
-
 Namibia
-
 Nepal
Nepal
-
 Netherlands
-
 New Zealand
-
 Nigeria
-
 North Macedonia
-
 Norway
-
 Oman
Oman
-
 Pakistan
-
 Palestine
-
 Panama
-
 Papua New Guinea
-
 Paraguay
-
 Peru
Peru
-
 Philippines
-
 Poland
-
 Portugal
-
 Puerto Rico
-
 Qatar
Qatar
-
 Reunion
-
 Romania
-
 Rwanda
-
 Saudi Arabia
-
 Serbia
-
 Singapore
-
 Slovakia
-
 Slovenia
-
 Somalia
-
 South Africa
-
 Spain
Spain
-
 Sri Lanka
-
 Sweden
-
 Switzerland
-
 Syria
Syria
-
 Taiwan
-
 Tajikistan
-
 Tanzania
-
 Thailand
-
 Trinidad and Tobago
-
 Tunisia
-
 Turkey
-
 UAE
UAE
-
 Uganda
-
 Ukraine
-
 United Kingdom
-
United States
-
 Uruguay
-
 Uzbekistan
-
 Venezuela
-
 Vietnam
-
 Yemen
Yemen
-
 Zambia
-
 Zimbabwe
- Forex
- Crypto
