
Walmart stock consolidates as technicals favor possible upside within current volatility: weekly review

Walmart Inc. (WMT) finished the week at $127.89, recording a decline of $2.03, or 1.69%, from the previous weekly close. The stock remains firmly positioned above its weekly MA-20 ($122.79), MA-50 ($109.97), and MA-200 ($74.35) levels, confirming a strong medium- and long-term bullish structure.
 112.49
111.80
112.49
111.80
Highlights
- Walmart maintains a strong medium- and long-term bullish technical structure, trading above all major weekly moving averages.
- Despite a 1.69% weekly decline to $127.89, buyers remain dominant and upward momentum persists on multiple key indicators.
- Price is expected to consolidate between $123.00 and $132.80 over the next week, with an 80% probability of upward movement barring a break below $123.00.
Revenue growth and bond issuance shape sentiment amid ESG initiatives
Walmart released its 2026 Annual Report and Proxy Statement, reporting a 4.7% increase in revenue to approximately $713.16 billion for the fiscal year ended January 31, 2026, and net income rising to $22.27 billion. The company raised $4.25 billion through a multi-tranche bond offering for general corporate purposes, including refinancing. Walmart is also addressing several ESG-related shareholder proposals at its upcoming annual meeting, while continuing to expand e-commerce and deploy AI initiatives across its operations.
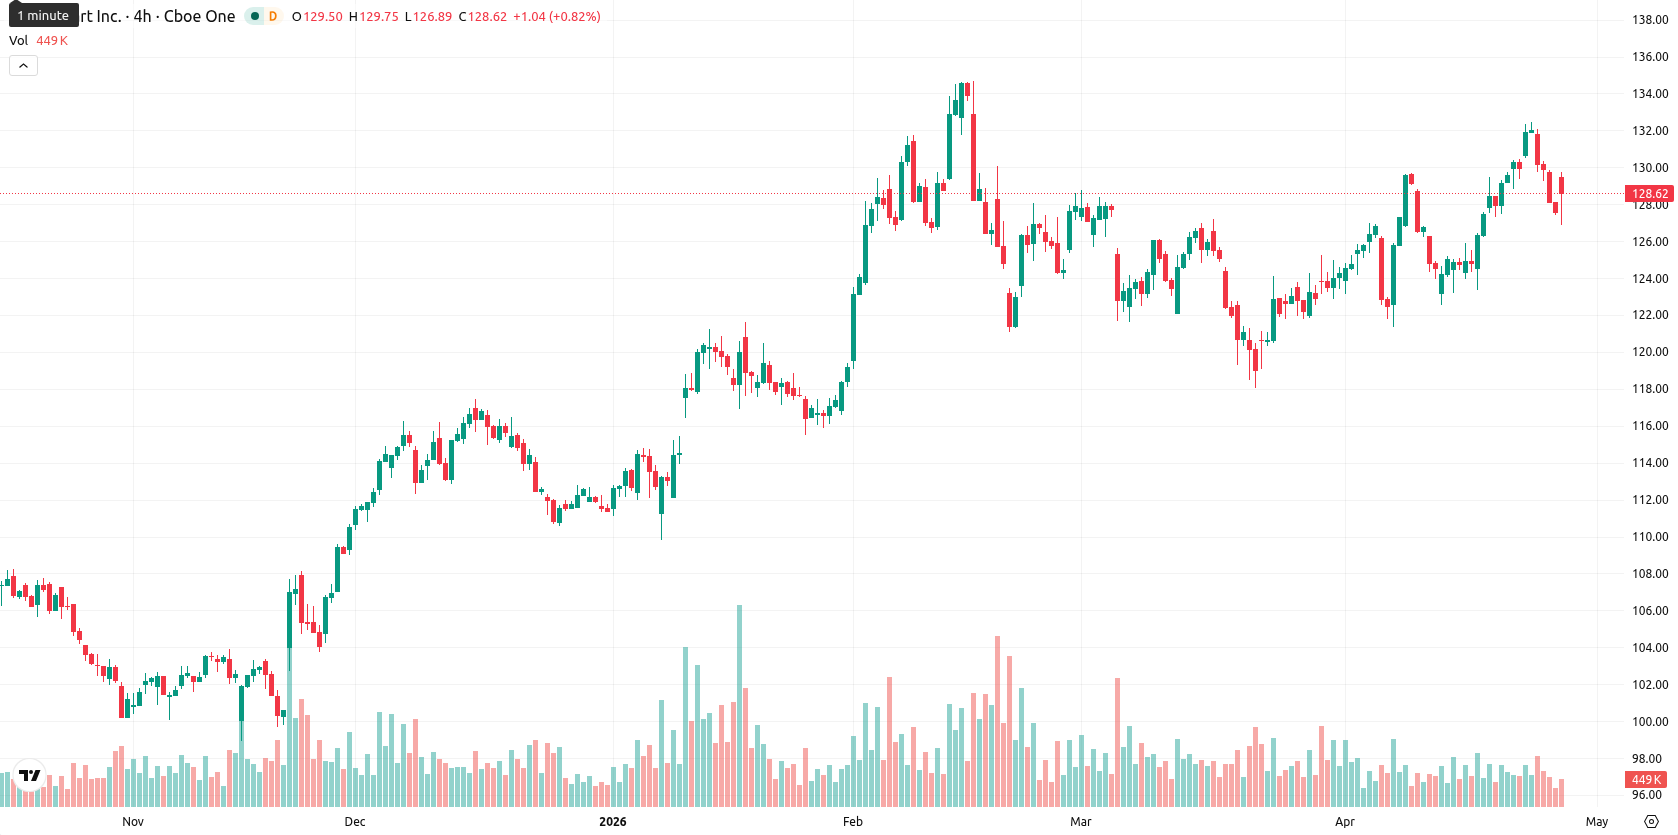
Bullish indicators persist as Walmart tests lower range boundary
On the weekly timeframe, Walmart shows a robust technical structure with the price above all major moving averages: MA-20 ($122.79), MA-50 ($109.97), and MA-200 ($74.35). The nearest dynamic support is at the MA-20, while MA-50 provides broader support. Over the past week, the price retreated to the lower boundary of its $127.42 — $132.46 range, with weekly volatility at 3.96%. Weekly indicators are mixed: MACD, ADX, RSI, and CCI remain bullish, but Stochastic RSI signals a potential near-term pullback. Bull/Bear Power and the Awesome Oscillator point to continued overall buyer strength.
Consolidation likely as breakout and correction risks remain for next week
For the next 5 trading days, the anticipated price range is $123.00 — $132.80, reflecting current volatility levels and confirming a consolidation phase. Technicals favor a high-probability upward move, as all four key weekly indicators remain Buy or Strong Buy, but some caution is warranted given weakness near support levels. A breakout above $132.80 could lead to renewed upside momentum, while a sustained drop below $123.00 may signal a deeper correction and possible trend reversal.
Previously, it was reported that lawmakers were pressuring Walmart and other major retailers to clarify their plans regarding tariff refunds following regulatory changes. The current technical and fundamental outlook for Walmart suggests traders should monitor the potential for an upside breakout above $132.80 as a trigger for renewed momentum, while remaining alert to a deeper pullback if support near $123.00 fails to hold.









-
 Afghanistan
-
 Albania
-
 Algeria
-
 Angola
-
 Argentina
-
 Armenia
-
 Australia
-
 Austria
-
 Azerbaijan
-
 Bahamas
-
 Bahrain
-
 Bangladesh
-
 Belarus
-
 Belgium
-
 Bolivia
-
 Botswana
-
 Brazil
-
 Brunei
-
 Bulgaria
-
 Cambodia
-
 Cameroon
-
 Canada
-
 Chile
Chile
-
 China
China
-
 Colombia
-
 Congo
Congo
-
 Costa Rica
-
 Cote d'Ivoire
-
 Croatia
-
 Cuba
Cuba
-
 Cyprus
-
 Czechia
-
 DR Congo
-
 Denmark
-
 Dominican Republic
-
 Ecuador
-
 Egypt
Egypt
-
 El Salvador
-
 Estonia
-
 Eswatini
-
 Ethiopia
-
 Finland
-
 France
-
 Georgia
-
 Germany
-
 Ghana
Ghana
-
 Greece
-
 Haiti
Haiti
-
 Hong Kong
-
 Hungary
-
 India
India
-
 Indonesia
-
 Iran, Islamic republic
-
 Iraq
Iraq
-
 Ireland
-
 Israel
-
 Italy
Italy
-
 Jamaica
-
 Japan
Japan
-
 Jordan
-
 Kazakhstan
-
 Kenya
Kenya
-
 Korea
Korea
-
 Kuwait
-
 Kyrgyzstan
-
 Laos
Laos
-
 Latvia
-
 Lebanon
-
 Lesotho
-
 Libya
Libya
-
 Lithuania
-
 Luxembourg
-
 Madagascar
-
 Malaysia
-
 Malta
Malta
-
 Mauritius
-
 Mexico
-
 Moldova
-
 Mongolia
-
 Montenegro
-
 Morocco
-
 Mozambique
-
 Myanmar
-
 Namibia
-
 Nepal
Nepal
-
 Netherlands
-
 New Zealand
-
 Nigeria
-
 North Macedonia
-
 Norway
-
 Oman
Oman
-
 Pakistan
-
 Palestine
-
 Panama
-
 Papua New Guinea
-
 Paraguay
-
 Peru
Peru
-
 Philippines
-
 Poland
-
 Portugal
-
 Puerto Rico
-
 Qatar
Qatar
-
 Reunion
-
 Romania
-
 Rwanda
-
 Saudi Arabia
-
 Serbia
-
 Singapore
-
 Slovakia
-
 Slovenia
-
 Somalia
-
 South Africa
-
 Spain
Spain
-
 Sri Lanka
-
 Sweden
-
 Switzerland
-
 Syria
Syria
-
 Taiwan
-
 Tajikistan
-
 Tanzania
-
 Thailand
-
 Trinidad and Tobago
-
 Tunisia
-
 Turkey
-
 UAE
UAE
-
 Uganda
-
 Ukraine
-
 United Kingdom
-
United States
-
 Uruguay
-
 Uzbekistan
-
 Venezuela
-
 Vietnam
-
 Yemen
Yemen
-
 Zambia
-
 Zimbabwe
- Forex
- Crypto












