
AMD stock declines as shares trade far above key moving averages

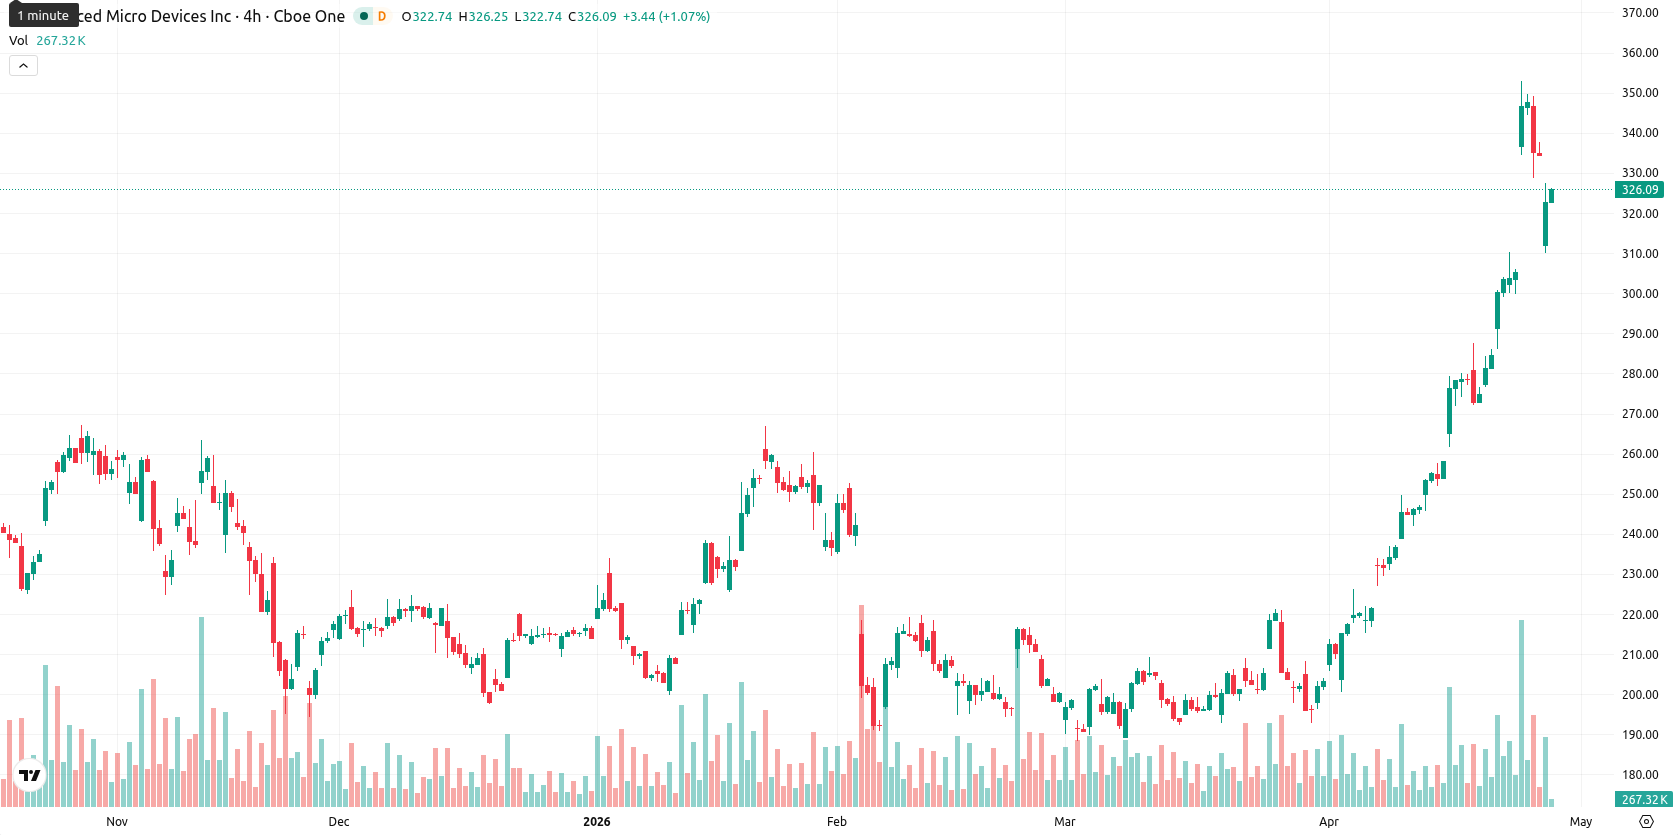
Advanced Micro Devices (AMD) is trading at $324.87, down 2.96% on the day. The price remains well above its key moving averages, reflecting a continued positive trend across all timeframes.
Highlights
- AMD is launching a multiyear AI infrastructure initiative, integrating AI at the core of corporate strategy ahead of May 5, 2026 earnings.
- Recognition for leadership in GPU and visual computing technology supports AMD's strategic positioning despite sector-wide selling pressures.
- AMD trades in a strong bullish trend with $310–$340 as the near-term expected range, but overbought technicals signal short-term correction risk.
Earnings anticipation and AI expansion guide sentiment amid selling pressure
AMD is set to report earnings on May 5, 2026. CEO Lisa Su described at the Axios AI+ Summit that the company is starting a decade-long AI infrastructure buildout, positioning AI as a central part of AMD's strategy. The company was also recognized for its leadership in visual computing and GPU technology, though price action has remained under broader selling pressure.
Overbought risks emerge as price consolidates above bullish benchmarks
The current price stands above the SMA-20 ($257.51), SMA-50 ($224.16), and SMA-200 ($207.55) levels. The D1 Ichimoku Kijun offers immediate support at $272.87. MACD and ADX on the daily chart continue to register bullish momentum, whereas the RSI at 80.04, CCI, Stoch RSI, and BBP all signal overbought conditions and increased risks of a short-term correction. Awesome Oscillator supports the prevailing positive bias, but price is consolidating between $316.38 and $327.45 after opening with an intraday gap down and encountering early session pressure.
Rangebound action likely as upward momentum faces volatility limits
For the week ahead, AMD is expected to trade within a $310 – $340 volatility band relative to current levels. The probability of an upward move remains high, but near-term consolidation within this range is the baseline scenario. A breakout above resistance may occur if momentum persists, while a break below $310 could prompt a sharper pullback toward the lower end of the band.
Earlier, analysts noted that AMD was demonstrating persistent bullish momentum supported by overbought technical conditions. With the current consolidation above key moving averages ahead of the upcoming earnings report, active traders should closely watch for a breakout above the established $340 resistance or a move below $310 to signal the next directional shift.


-
 Afghanistan
-
 Albania
-
 Algeria
-
 Angola
-
 Argentina
-
 Armenia
-
 Australia
-
 Austria
-
 Azerbaijan
-
 Bahamas
-
 Bahrain
-
 Bangladesh
-
 Belarus
-
 Belgium
-
 Bolivia
-
 Botswana
-
 Brazil
-
 Brunei
-
 Bulgaria
-
 Cambodia
-
 Cameroon
-
 Canada
-
 Chile
Chile
-
 China
China
-
 Colombia
-
 Congo
Congo
-
 Costa Rica
-
 Cote d'Ivoire
-
 Croatia
-
 Cuba
Cuba
-
 Cyprus
-
 Czechia
-
 DR Congo
-
 Denmark
-
 Dominican Republic
-
 Ecuador
-
 Egypt
Egypt
-
 El Salvador
-
 Estonia
-
 Eswatini
-
 Ethiopia
-
 Finland
-
 France
-
 Georgia
-
 Germany
-
 Ghana
Ghana
-
 Greece
-
 Haiti
Haiti
-
 Hong Kong
-
 Hungary
-
 India
India
-
 Indonesia
-
 Iran, Islamic republic
-
 Iraq
Iraq
-
 Ireland
-
 Israel
-
 Italy
Italy
-
 Jamaica
-
 Japan
Japan
-
 Jordan
-
 Kazakhstan
-
 Kenya
Kenya
-
 Korea
Korea
-
 Kuwait
-
 Kyrgyzstan
-
 Laos
Laos
-
 Latvia
-
 Lebanon
-
 Lesotho
-
 Libya
Libya
-
 Lithuania
-
 Luxembourg
-
 Madagascar
-
 Malaysia
-
 Malta
Malta
-
 Mauritius
-
 Mexico
-
 Moldova
-
 Mongolia
-
 Montenegro
-
 Morocco
-
 Mozambique
-
 Myanmar
-
 Namibia
-
 Nepal
Nepal
-
 Netherlands
-
 New Zealand
-
 Nigeria
-
 North Macedonia
-
 Norway
-
 Oman
Oman
-
 Pakistan
-
 Palestine
-
 Panama
-
 Papua New Guinea
-
 Paraguay
-
 Peru
Peru
-
 Philippines
-
 Poland
-
 Portugal
-
 Puerto Rico
-
 Qatar
Qatar
-
 Reunion
-
 Romania
-
 Rwanda
-
 Saudi Arabia
-
 Serbia
-
 Singapore
-
 Slovakia
-
 Slovenia
-
 Somalia
-
 South Africa
-
 Spain
Spain
-
 Sri Lanka
-
 Sweden
-
 Switzerland
-
 Syria
Syria
-
 Taiwan
-
 Tajikistan
-
 Tanzania
-
 Thailand
-
 Trinidad and Tobago
-
 Tunisia
-
 Turkey
-
 UAE
UAE
-
 Uganda
-
 Ukraine
-
 United Kingdom
-
United States
-
 Uruguay
-
 Uzbekistan
-
 Venezuela
-
 Vietnam
-
 Yemen
Yemen
-
 Zambia
-
 Zimbabwe
- Forex
- Crypto
