
Meta stock price forecast: $678 resistance level as META trades flat

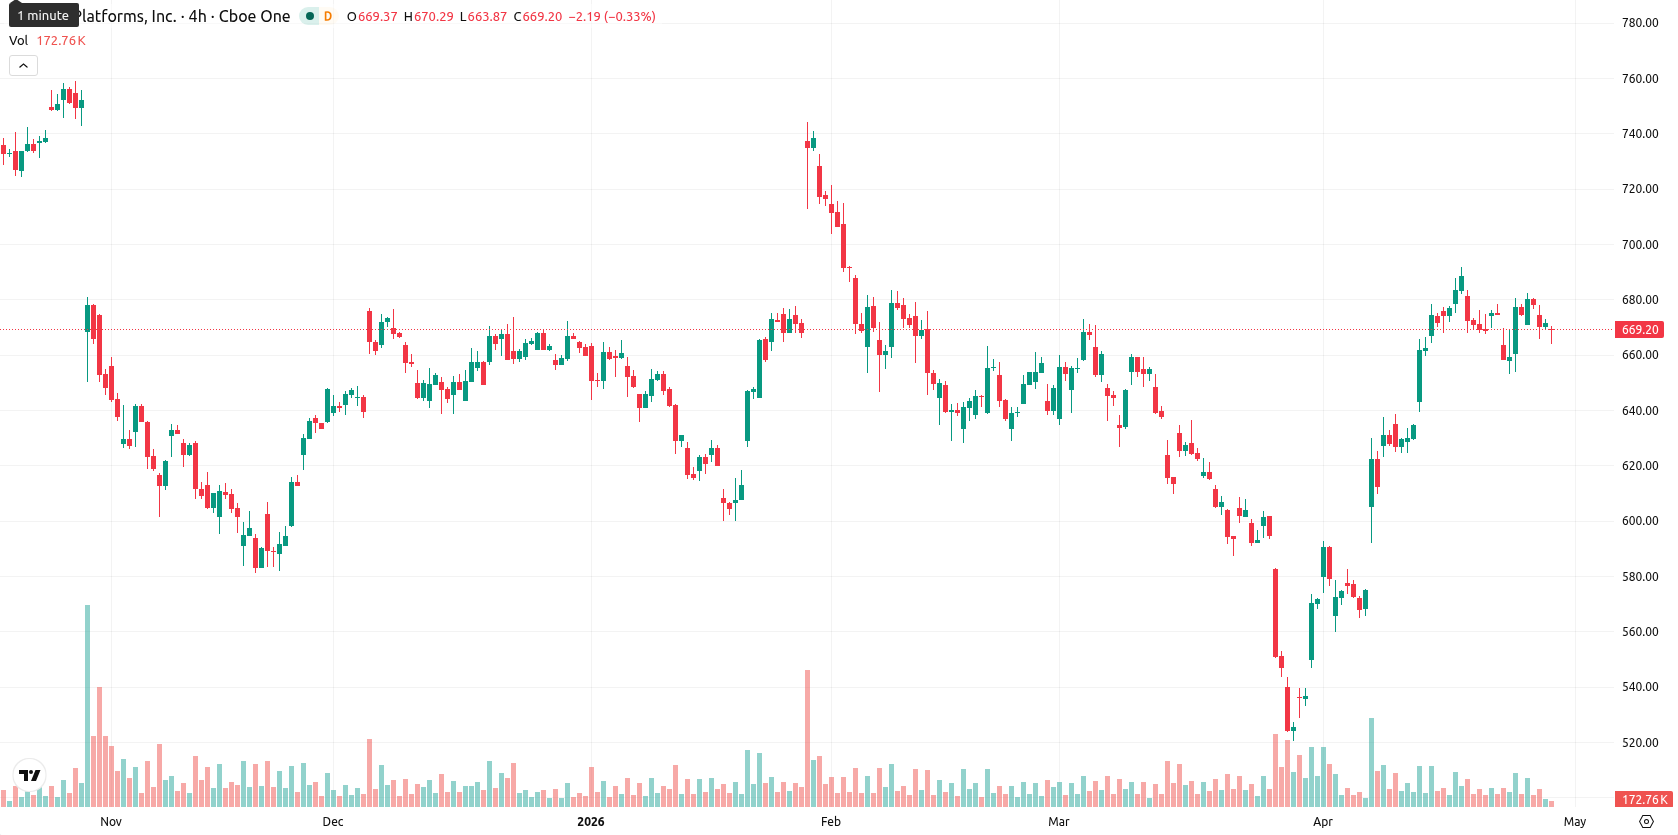
Meta Platforms, Inc. (META, formerly Facebook) is trading at $672.42, up 0.35% on the day and currently positioned above its key short- and medium-term moving averages, while still below the longer-term trend level.
Highlights
- Meta is projected to report robust Q1 2026 earnings, with revenue near $55.5 billion and EPS up about 31% year-over-year.
- The company abandoned its $2 billion acquisition of Manus after a regulatory block in China, while sharply increasing AI-related capital expenditures to $115–135 billion.
- Technicals show the stock in a short-term bullish structure but with fragile momentum, expected to trade sideways between $654 and $678 amid increased downside risk.
Earnings optimism muted by Manus deal unwind and capex surge
Meta is preparing to report its first quarter 2026 earnings on April 29, with market expectations focused on revenue around $55.5 billion and earnings per share between $6.67 and $6.68, an increase of approximately 31% year-over-year. The company has decided to unwind its planned $2 billion acquisition of Manus, a Singapore-based AI startup, following a block by China's National Development and Reform Commission over technology transfer concerns. Capital expenditures for 2026 are also set to rise sharply, with projected investments between $115 billion and $135 billion as Meta pushes forward on artificial intelligence and Superintelligence Labs initiatives.
Mixed oscillator signals as META faces resistance below MA-200
META trades above the MA-20 at $638.78 and MA-50 at $631.02, but remains below the MA-200 at $679.50. The Ichimoku Kijun level sits at $605.99, providing immediate support. The MACD is bullish on the daily timeframe, while the ADX at 15.69 signals a weak trend. RSI is near 59 and CCI around 60, both reflecting mild buying momentum, yet Stochastic RSI is oversold and BBP indicates overbought conditions, pointing to strong buyer influence intraday. The Awesome Oscillator is neutral. Today opened with a small gap down from $670.05 to $664.39, and price action remains within the day's low-volatility range of $664.13–$670.28, highlighting steady but fragile upside momentum as oscillators diverge.
Sideways trade expected as upside risk remains limited
Over the next five trading days, META is likely to move within a $654 to $678 volatility band relative to current levels. The probability of a sustained upside move is low, with less than a 20% chance for further gains according to the prevailing weekly signals. The baseline outlook is for sideways consolidation in this range. Should the price break above $678, a test of the MA-200 is plausible, while a drop below $654 may prompt a corrective move toward support near the MA-20 and Kijun levels.
Earlier, analysts noted that Meta was facing mixed technical signals and diminished short-term upside momentum amid ongoing corporate developments. The latest market action and continued divergence among oscillators reinforce the outlook for sideways consolidation, making the $678 resistance level a critical threshold for any potential bullish breakout in the coming sessions.


Latest META News


-
 Afghanistan
-
 Albania
-
 Algeria
-
 Angola
-
 Argentina
-
 Armenia
-
 Australia
-
 Austria
-
 Azerbaijan
-
 Bahamas
-
 Bahrain
-
 Bangladesh
-
 Belarus
-
 Belgium
-
 Bolivia
-
 Botswana
-
 Brazil
-
 Brunei
-
 Bulgaria
-
 Cambodia
-
 Cameroon
-
 Canada
-
 Chile
Chile
-
 China
China
-
 Colombia
-
 Congo
Congo
-
 Costa Rica
-
 Cote d'Ivoire
-
 Croatia
-
 Cuba
Cuba
-
 Cyprus
-
 Czechia
-
 DR Congo
-
 Denmark
-
 Dominican Republic
-
 Ecuador
-
 Egypt
Egypt
-
 El Salvador
-
 Estonia
-
 Eswatini
-
 Ethiopia
-
 Finland
-
 France
-
 Georgia
-
 Germany
-
 Ghana
Ghana
-
 Greece
-
 Haiti
Haiti
-
 Hong Kong
-
 Hungary
-
 India
India
-
 Indonesia
-
 Iran, Islamic republic
-
 Iraq
Iraq
-
 Ireland
-
 Israel
-
 Italy
Italy
-
 Jamaica
-
 Japan
Japan
-
 Jordan
-
 Kazakhstan
-
 Kenya
Kenya
-
 Korea
Korea
-
 Kuwait
-
 Kyrgyzstan
-
 Laos
Laos
-
 Latvia
-
 Lebanon
-
 Lesotho
-
 Libya
Libya
-
 Lithuania
-
 Luxembourg
-
 Madagascar
-
 Malaysia
-
 Malta
Malta
-
 Mauritius
-
 Mexico
-
 Moldova
-
 Mongolia
-
 Montenegro
-
 Morocco
-
 Mozambique
-
 Myanmar
-
 Namibia
-
 Nepal
Nepal
-
 Netherlands
-
 New Zealand
-
 Nigeria
-
 North Macedonia
-
 Norway
-
 Oman
Oman
-
 Pakistan
-
 Palestine
-
 Panama
-
 Papua New Guinea
-
 Paraguay
-
 Peru
Peru
-
 Philippines
-
 Poland
-
 Portugal
-
 Puerto Rico
-
 Qatar
Qatar
-
 Reunion
-
 Romania
-
 Rwanda
-
 Saudi Arabia
-
 Serbia
-
 Singapore
-
 Slovakia
-
 Slovenia
-
 Somalia
-
 South Africa
-
 Spain
Spain
-
 Sri Lanka
-
 Sweden
-
 Switzerland
-
 Syria
Syria
-
 Taiwan
-
 Tajikistan
-
 Tanzania
-
 Thailand
-
 Trinidad and Tobago
-
 Tunisia
-
 Turkey
-
 UAE
UAE
-
 Uganda
-
 Ukraine
-
 United Kingdom
-
United States
-
 Uruguay
-
 Uzbekistan
-
 Venezuela
-
 Vietnam
-
 Yemen
Yemen
-
 Zambia
-
 Zimbabwe
- Forex
- Crypto
