
Tesla stock price forecast: $400 resistance as TSLA trades flat

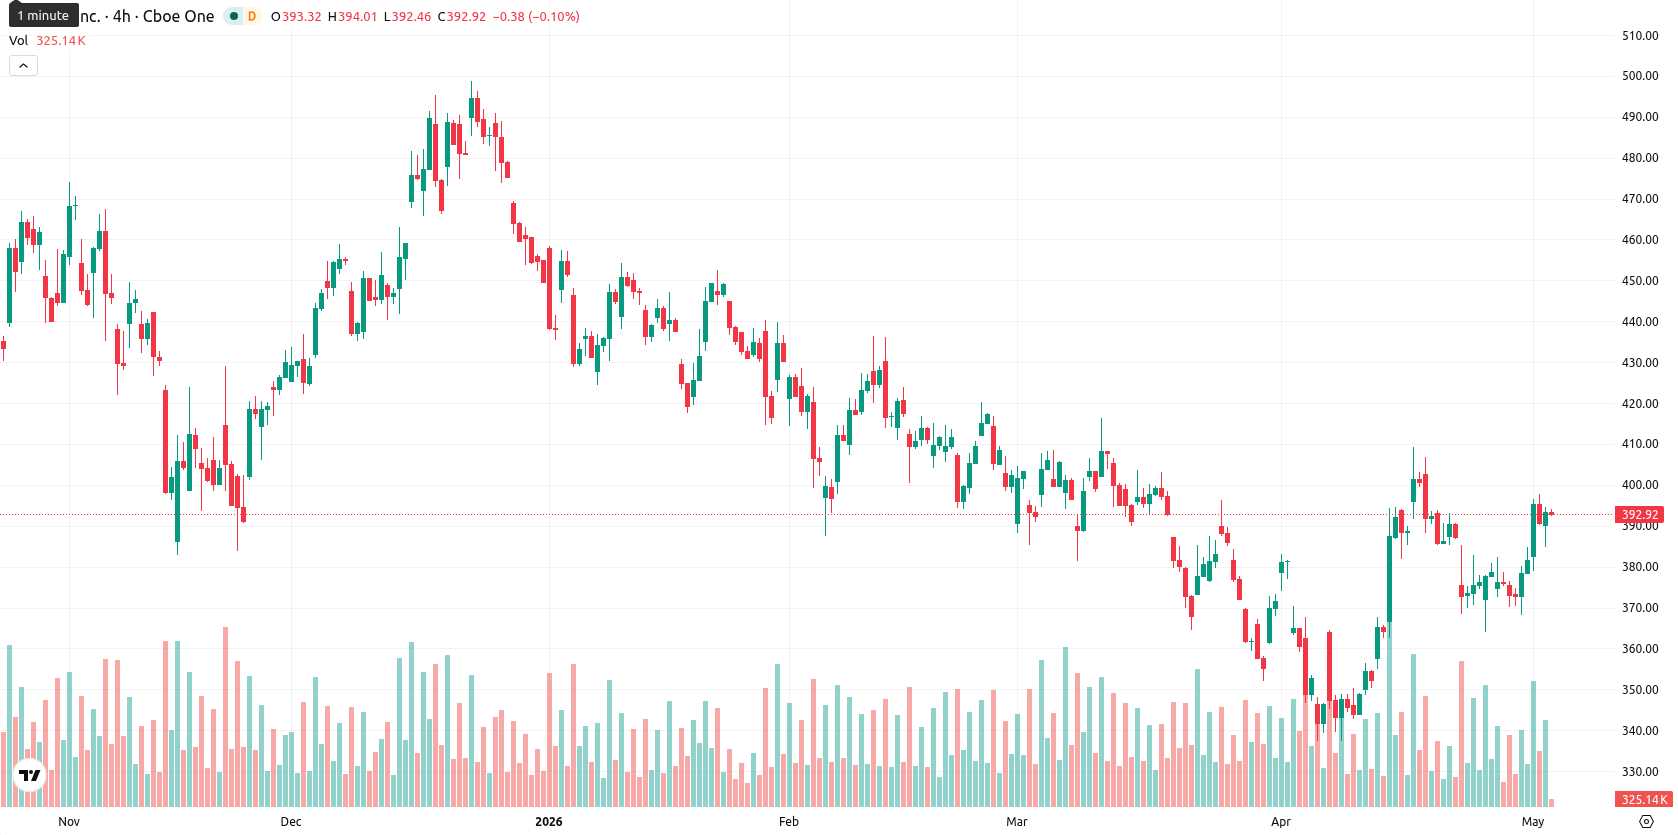
Tesla, Inc. (TSLA) is trading at $392.67, gaining 0.38% on the day. The price is positioned above its key short- and medium-term moving averages, reflecting continued upward momentum in the near term.
Highlights
- Sustained U.S.-China trade tensions, including upheld tariffs, are heightening supply chain and cost risks for Tesla's operations.
- Potential Chinese retaliation and added U.S. tariffs on foreign-built vehicles threaten Tesla's market position and margins globally.
- Technicals show TSLA is overbought with weak upward momentum, pricing likely to consolidate between $385 and $400 in the short term.
Operational and cost risks rise amid trade tensions and tariffs
Escalating trade tensions between the U.S. and China are intensifying operational and supply chain risks for Tesla, given the company's heavy reliance on its Giga Shanghai facility for production and battery sourcing. The recent Supreme Court decision to uphold significant Trump-era tariffs has ensured the continuation of protectionist U.S. trade policies, sustaining cost and regulatory pressures on Tesla's international manufacturing and sales operations. Signals from the current administration about maintaining or escalating these measures, combined with the threat of Chinese retaliation targeting Tesla's position and margins in the Chinese market, are further compounding risks. Additional tariff threats from the U.S. against European-built vehicles also add layers of potential regulatory disruption to Tesla's global business model.
Short-term bullishness persists below long-term resistance as volatility holds
TSLA currently sits above the SMA-20 at $372.57 and SMA-50 at $383.72, but remains below the SMA-200 at $402.49. The Ichimoku Kijun (D1) provides immediate support at $373.16. On momentum, MACD and ADX readings are neutral, while the RSI signals overbought conditions and the Awesome Oscillator points to bullish momentum. BBP levels indicate strong buyer dominance and overbought intraday readings, with Stoch RSI and CCI in neutral to overbought territory. Trading opened with a small gap down but rebounded into the upper end of the daily range, sustaining moderate volatility.
Pullback risk increases as overbought signals challenge further upside
For the coming week, TSLA is expected to trade within a volatility band stretching from $385 to $400. There is a low probability (under 20%) of a sustained move above the $400 level, making a short-term pullback more likely. The baseline scenario anticipates price consolidation in this range, with a decisive move above $400 required for renewed bullish momentum, while a decline below the $385 support zone would confirm bearish pressure. Given the overbought readings and neutral momentum signals on higher timeframes, a cautious approach to aggressive long positions is advisable.
Previously it was reported that Tesla's shares were exhibiting mixed technical momentum amid heightened scrutiny of executive compensation, legal exposures, and operational risks. With the current escalation of global trade tensions and mounting regulatory pressures, traders should monitor the $400 threshold as a critical inflection point, where a sustained move above could trigger renewed bullish sentiment or, alternatively, a reversal may signal further downside risk.


Latest Tesla News


-
 Afghanistan
-
 Albania
-
 Algeria
-
 Angola
-
 Argentina
-
 Armenia
-
 Australia
-
 Austria
-
 Azerbaijan
-
 Bahamas
-
 Bahrain
-
 Bangladesh
-
 Belarus
-
 Belgium
-
 Bolivia
-
 Botswana
-
 Brazil
-
 Brunei
-
 Bulgaria
-
 Cambodia
-
 Cameroon
-
 Canada
-
 Chile
Chile
-
 China
China
-
 Colombia
-
 Congo
Congo
-
 Costa Rica
-
 Cote d'Ivoire
-
 Croatia
-
 Cuba
Cuba
-
 Cyprus
-
 Czechia
-
 DR Congo
-
 Denmark
-
 Dominican Republic
-
 Ecuador
-
 Egypt
Egypt
-
 El Salvador
-
 Estonia
-
 Eswatini
-
 Ethiopia
-
 Finland
-
 France
-
 Georgia
-
 Germany
-
 Ghana
Ghana
-
 Greece
-
 Haiti
Haiti
-
 Hong Kong
-
 Hungary
-
 India
India
-
 Indonesia
-
 Iran, Islamic republic
-
 Iraq
Iraq
-
 Ireland
-
 Israel
-
 Italy
Italy
-
 Jamaica
-
 Japan
Japan
-
 Jordan
-
 Kazakhstan
-
 Kenya
Kenya
-
 Korea
Korea
-
 Kuwait
-
 Kyrgyzstan
-
 Laos
Laos
-
 Latvia
-
 Lebanon
-
 Lesotho
-
 Libya
Libya
-
 Lithuania
-
 Luxembourg
-
 Madagascar
-
 Malaysia
-
 Malta
Malta
-
 Mauritius
-
 Mexico
-
 Moldova
-
 Mongolia
-
 Montenegro
-
 Morocco
-
 Mozambique
-
 Myanmar
-
 Namibia
-
 Nepal
Nepal
-
 Netherlands
-
 New Zealand
-
 Nigeria
-
 North Macedonia
-
 Norway
-
 Oman
Oman
-
 Pakistan
-
 Palestine
-
 Panama
-
 Papua New Guinea
-
 Paraguay
-
 Peru
Peru
-
 Philippines
-
 Poland
-
 Portugal
-
 Puerto Rico
-
 Qatar
Qatar
-
 Reunion
-
 Romania
-
 Rwanda
-
 Saudi Arabia
-
 Serbia
-
 Singapore
-
 Slovakia
-
 Slovenia
-
 Somalia
-
 South Africa
-
 Spain
Spain
-
 Sri Lanka
-
 Sweden
-
 Switzerland
-
 Syria
Syria
-
 Taiwan
-
 Tajikistan
-
 Tanzania
-
 Thailand
-
 Trinidad and Tobago
-
 Tunisia
-
 Turkey
-
 UAE
UAE
-
 Uganda
-
 Ukraine
-
 United Kingdom
-
United States
-
 Uruguay
-
 Uzbekistan
-
 Venezuela
-
 Vietnam
-
 Yemen
Yemen
-
 Zambia
-
 Zimbabwe
- Forex
- Crypto
