
COST shares show mixed momentum with RSI indicating sustained buyer interest: weekly analysis

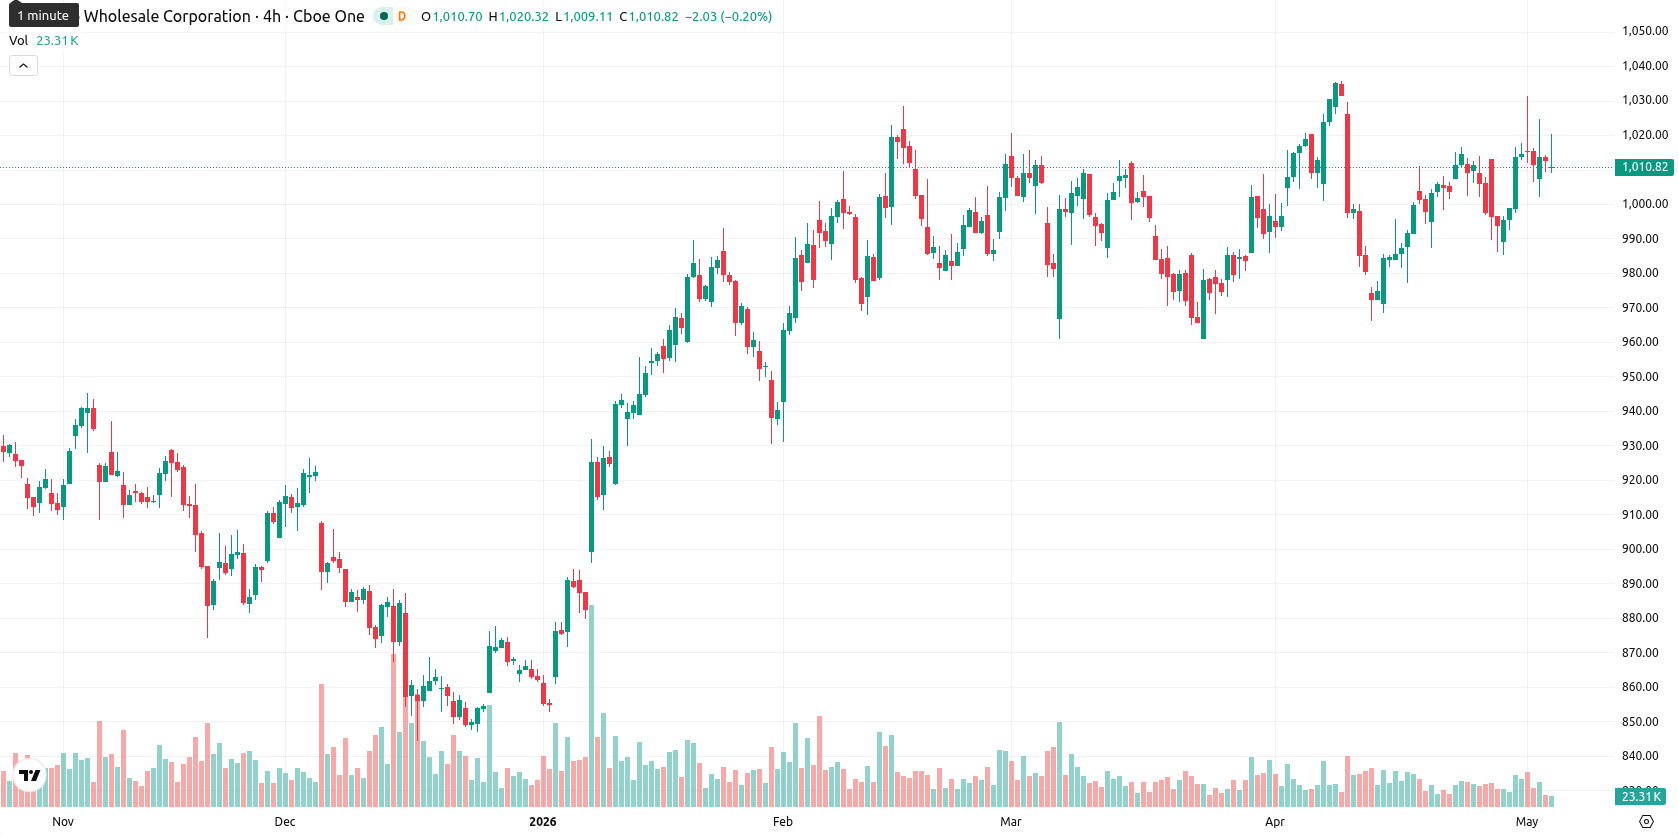
Costco Wholesale Corporation (COST) is currently trading at $1,011.30, well above its weekly MA-20 at $978.33, MA-50 at $958.82, and MA-200 at $759.16. Over the past week, COST slipped $0.29 (0.06%), consolidating in the middle of its weekly range and maintaining a strong bullish structure with dynamic moving average support.
 956.10
956.10
956.10
Highlights
- Costco trades above medium- and long-term support levels, maintaining a robust bullish technical structure.
- Momentum and buyer interest remain primarily positive, but market is consolidating with neutral trend strength and overbought signals.
- Price is expected to move within $967 to $1,055 over the next week, with a 75% probability of upside continuation.
Membership gains and mixed institutional flows shape weekly sentiment
Costco continues to demonstrate robust financial performance, maintaining $18.24 billion in liquid assets and low debt while moving forward with plans to open 28 new warehouses. The company's increased membership fees and a worldwide renewal rate of 89.7% contributed to stable cash flows, with its paid membership base reaching 82.1 million. Institutional activity was mixed, as WT Wealth Management increased its stake by 34% while Truist Financial Corp reduced its position, and the company raised its quarterly dividend to $1.47 per share.
Buyer momentum persists as mixed oscillators keep trend in check
On the weekly timeframe, Costco remains in a strong technical position above all key moving averages, with the MA-20 and MA-50 providing important dynamic support. Weekly support and resistance levels are seen at $967 and $1,055, respectively. The RSI on the weekly chart signals ongoing buyer interest, with the MACD also on Buy and ADX trending neutral, indicating sustained though not accelerating momentum. Oscillator signals are mixed, as CCI and RSI are constructive, Stochastic RSI is neutral, and Bull/Bear Power points to an overbought market dominated by buyers.
Range-bound outlook with breakout risk as momentum signals bias bullish
For the next 5 trading days, consolidation within the $967 to $1,055 range is the baseline scenario given the neutral weekly tone and prevailing momentum signals. There remains about a 75% chance of price moving higher and a 25% probability of a pullback, guided by 3 out of 4 key weekly indicators remaining on Buy or Strong Buy. A bullish breakout above $1,055 could be triggered if buyer momentum persists, while a bearish scenario would require a drop below $967, driven by profit-taking as overbought conditions unwind.
Previously it was reported that Costco maintained a broadly bullish technical and fundamental outlook, supported by solid earnings growth and a rising dividend. The latest developments — including stable cash flows from higher membership fees and continued technical strength — reinforce this view, with the $1,055 resistance now emerging as the key level to watch for a potential bullish breakout.








-
 Afghanistan
-
 Albania
-
 Algeria
-
 Angola
-
 Argentina
-
 Armenia
-
 Australia
-
 Austria
-
 Azerbaijan
-
 Bahamas
-
 Bahrain
-
 Bangladesh
-
 Belarus
-
 Belgium
-
 Bolivia
-
 Botswana
-
 Brazil
-
 Brunei
-
 Bulgaria
-
 Cambodia
-
 Cameroon
-
 Canada
-
 Chile
Chile
-
 China
China
-
 Colombia
-
 Congo
Congo
-
 Costa Rica
-
 Cote d'Ivoire
-
 Croatia
-
 Cuba
Cuba
-
 Cyprus
-
 Czechia
-
 DR Congo
-
 Denmark
-
 Dominican Republic
-
 Ecuador
-
 Egypt
Egypt
-
 El Salvador
-
 Estonia
-
 Eswatini
-
 Ethiopia
-
 Finland
-
 France
-
 Georgia
-
 Germany
-
 Ghana
Ghana
-
 Greece
-
 Haiti
Haiti
-
 Hong Kong
-
 Hungary
-
 India
India
-
 Indonesia
-
 Iran, Islamic republic
-
 Iraq
Iraq
-
 Ireland
-
 Israel
-
 Italy
Italy
-
 Jamaica
-
 Japan
Japan
-
 Jordan
-
 Kazakhstan
-
 Kenya
Kenya
-
 Korea
Korea
-
 Kuwait
-
 Kyrgyzstan
-
 Laos
Laos
-
 Latvia
-
 Lebanon
-
 Lesotho
-
 Libya
Libya
-
 Lithuania
-
 Luxembourg
-
 Madagascar
-
 Malaysia
-
 Malta
Malta
-
 Mauritius
-
 Mexico
-
 Moldova
-
 Mongolia
-
 Montenegro
-
 Morocco
-
 Mozambique
-
 Myanmar
-
 Namibia
-
 Nepal
Nepal
-
 Netherlands
-
 New Zealand
-
 Nigeria
-
 North Macedonia
-
 Norway
-
 Oman
Oman
-
 Pakistan
-
 Palestine
-
 Panama
-
 Papua New Guinea
-
 Paraguay
-
 Peru
Peru
-
 Philippines
-
 Poland
-
 Portugal
-
 Puerto Rico
-
 Qatar
Qatar
-
 Reunion
-
 Romania
-
 Rwanda
-
 Saudi Arabia
-
 Serbia
-
 Singapore
-
 Slovakia
-
 Slovenia
-
 Somalia
-
 South Africa
-
 Spain
Spain
-
 Sri Lanka
-
 Sweden
-
 Switzerland
-
 Syria
Syria
-
 Taiwan
-
 Tajikistan
-
 Tanzania
-
 Thailand
-
 Trinidad and Tobago
-
 Tunisia
-
 Turkey
-
 UAE
UAE
-
 Uganda
-
 Ukraine
-
 United Kingdom
-
United States
-
 Uruguay
-
 Uzbekistan
-
 Venezuela
-
 Vietnam
-
 Yemen
Yemen
-
 Zambia
-
 Zimbabwe
- Forex
- Crypto












