

Silicon Data partnership lifts CME Group stock higher

CME Group Inc. (CME) is trading at $295.13, posting a daily gain of 3.28%. The stock sits above its key short-term averages, while maintaining a positive stance against longer-term trend metrics.
 280.42
283.20
280.42
283.20
Highlights
- CME Group is partnering with Silicon Data to launch futures contracts tied to GPU rental, expanding offerings for institutional clients targeting AI compute exposure.
- This initiative is attracting industry attention as it provides new hedging tools for managing AI sector price volatility.
- CME stock shows short-term bullish momentum with overbought technicals, but mixed signals suggest sideways trading near $295 within a $285–$305 range.
AI-linked compute futures initiative as catalyst for institutional demand
CME Group’s announcement of a partnership with Silicon Data to launch a standardized compute futures market represents a notable expansion of its product suite for institutional clients. By planning futures contracts tied to GPU rental benchmarks, CME is positioning itself to capitalize on rising demand for risk management solutions in the rapidly growing AI compute sector. The joint formal announcement by both firms enhances visibility for the initiative and has drawn attention from market participants anticipating new ways to hedge or gain exposure to AI-related price volatility.
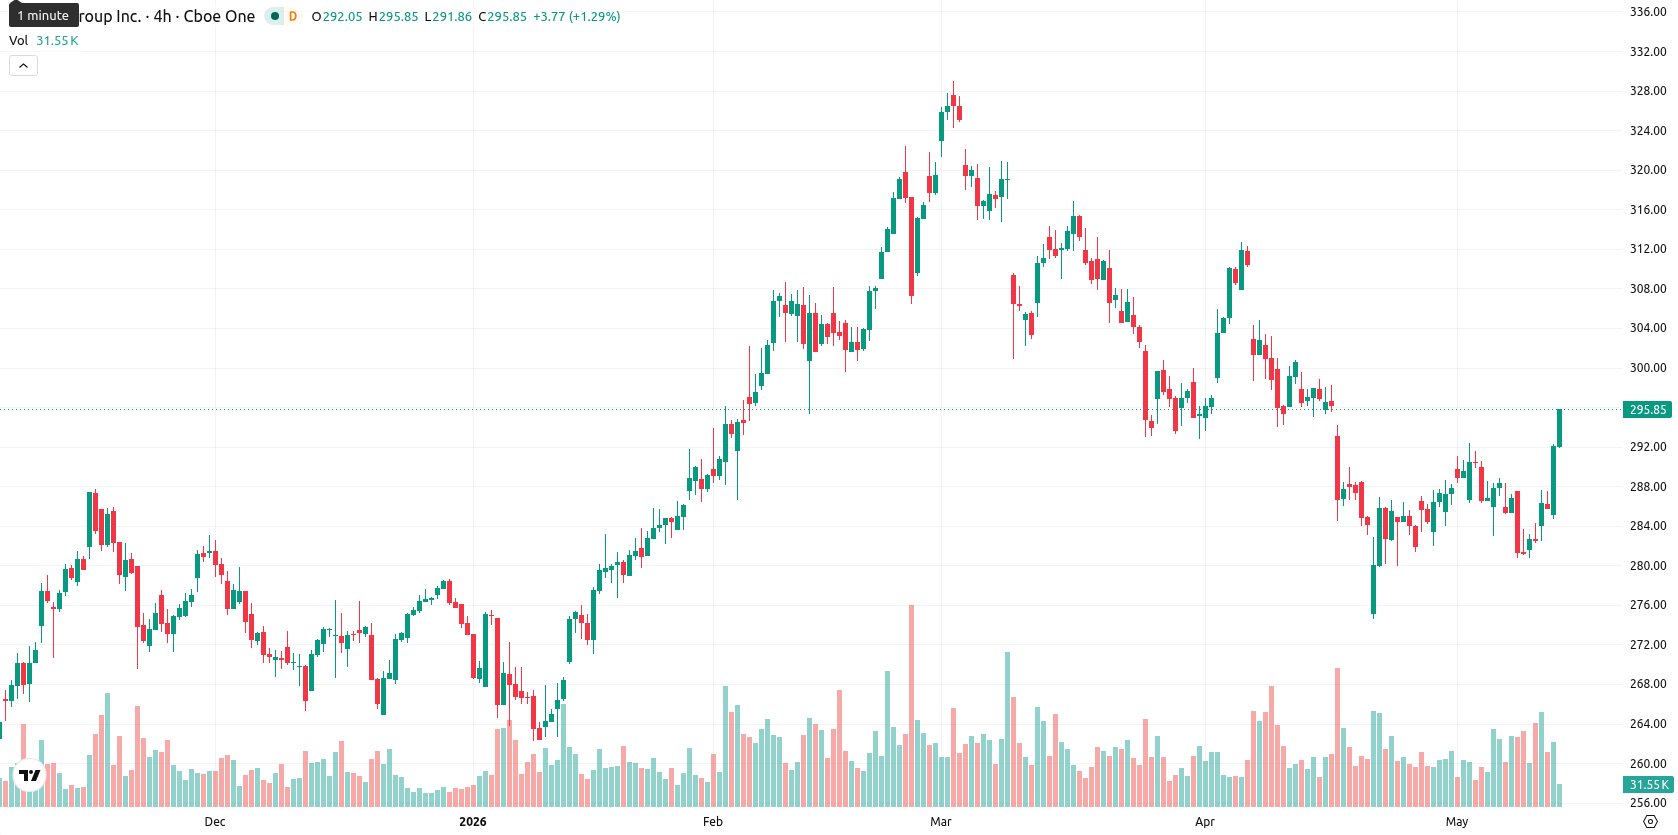
Mixed technical signals amid resistance at SMA-50 and momentum divergence
SMA-20 is currently at $287.09, with the price maintaining proximity above it, while the SMA-50 at $298.59 remains as immediate overhead resistance. The SMA-200, set at $282.02, marks a significant support zone. The Ichimoku Kijun on the daily chart is at $293.64 and now serves as immediate support. On the indicators front, MACD remains firmly negative (Strong Sell), ADX suggests a weakening trend, and RSI is at 43.60, in sell territory. Both Stoch RSI and Bull/Bear Power (BBP) display overbought conditions, indicating heightened buyer activity that may be reaching exhaustion. The Awesome Oscillator shows a lack of active support for prevailing momentum, while divergences among oscillators signal possible near-term pullback risks, despite the strong intraday performance and high volatility.
Sideways price risk as sell signals dominate despite recent gains
Over the next five days, CME is expected to trade within a typical volatility band between $285 and $305. The probability of a further price increase is low—estimated at under 20%—given the predominance of sell signals across RSI, MACD, and ADX on daily and weekly timeframes. The baseline scenario points to sideways movement near current levels. Should CME break and hold above the SMA-50 and the $305 resistance, a bullish extension becomes likely. Conversely, failure to clear resistance could see the price retrace toward $285 or test support around $282.
Earlier, analysts noted that CME Group was demonstrating short-term upside enthusiasm despite mixed technical signals and broader corrective pressures. The current setup introduces increased volatility and signals that sustained movement above the $305 resistance could ignite a bullish extension, while failure to break through may prompt a retest of support near $282.





Latest CME Group News






-
 Afghanistan
-
 Albania
-
 Algeria
-
 Angola
-
 Argentina
-
 Armenia
-
 Australia
-
 Austria
-
 Azerbaijan
-
 Bahamas
-
 Bahrain
-
 Bangladesh
-
 Belarus
-
 Belgium
-
 Bolivia
-
 Botswana
-
 Brazil
-
 Brunei
-
 Bulgaria
-
 Cambodia
-
 Cameroon
-
 Canada
-
 Chile
Chile
-
 China
China
-
 Colombia
-
 Congo
Congo
-
 Costa Rica
-
 Cote d'Ivoire
-
 Croatia
-
 Cuba
Cuba
-
 Cyprus
-
 Czechia
-
 DR Congo
-
 Denmark
-
 Dominican Republic
-
 Ecuador
-
 Egypt
Egypt
-
 El Salvador
-
 Estonia
-
 Eswatini
-
 Ethiopia
-
 Finland
-
 France
-
 Georgia
-
 Germany
-
 Ghana
Ghana
-
 Greece
-
 Haiti
Haiti
-
 Hong Kong
-
 Hungary
-
 India
India
-
 Indonesia
-
 Iran, Islamic republic
-
 Iraq
Iraq
-
 Ireland
-
 Israel
-
 Italy
Italy
-
 Jamaica
-
 Japan
Japan
-
 Jordan
-
 Kazakhstan
-
 Kenya
Kenya
-
 Korea
Korea
-
 Kuwait
-
 Kyrgyzstan
-
 Laos
Laos
-
 Latvia
-
 Lebanon
-
 Lesotho
-
 Libya
Libya
-
 Lithuania
-
 Luxembourg
-
 Madagascar
-
 Malaysia
-
 Malta
Malta
-
 Mauritius
-
 Mexico
-
 Moldova
-
 Mongolia
-
 Montenegro
-
 Morocco
-
 Mozambique
-
 Myanmar
-
 Namibia
-
 Nepal
Nepal
-
 Netherlands
-
 New Zealand
-
 Nigeria
-
 North Macedonia
-
 Norway
-
 Oman
Oman
-
 Pakistan
-
 Palestine
-
 Panama
-
 Papua New Guinea
-
 Paraguay
-
 Peru
Peru
-
 Philippines
-
 Poland
-
 Portugal
-
 Puerto Rico
-
 Qatar
Qatar
-
 Reunion
-
 Romania
-
 Rwanda
-
 Saudi Arabia
-
 Serbia
-
 Singapore
-
 Slovakia
-
 Slovenia
-
 Somalia
-
 South Africa
-
 Spain
Spain
-
 Sri Lanka
-
 Sweden
-
 Switzerland
-
 Syria
Syria
-
 Taiwan
-
 Tajikistan
-
 Tanzania
-
 Thailand
-
 Trinidad and Tobago
-
 Tunisia
-
 Turkey
-
 UAE
UAE
-
 Uganda
-
 Ukraine
-
 United Kingdom
-
United States
-
 Uruguay
-
 Uzbekistan
-
 Venezuela
-
 Vietnam
-
 Yemen
Yemen
-
 Zambia
-
 Zimbabwe
- Forex
- Crypto












