
AAPL shares hold steady with price above key moving averages: weekly forecast

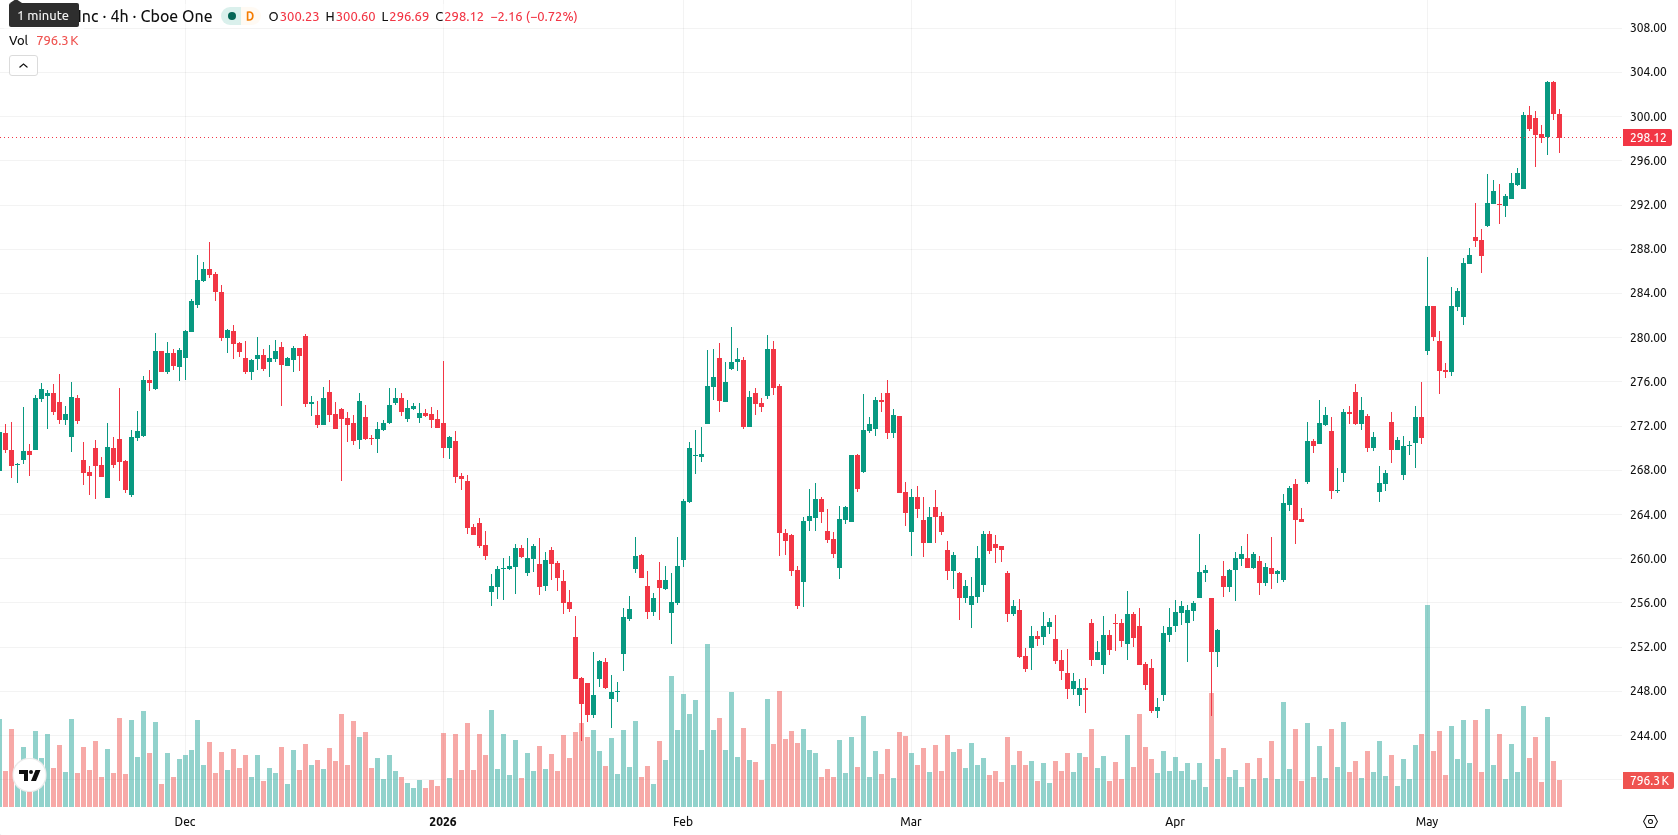
Apple Inc. (AAPL) is currently trading at $298.33, maintaining a position well above its weekly MA-20 at $264.57, MA-50 at $250.48, and MA-200 at $203.65. Over the past week, the stock slipped by $1.72 (0.62%), reflecting a mild pullback and short-term consolidation within a generally bullish medium- and long-term trend.
Highlights
- Apple maintains a bullish medium- and long-term trend, trading above all major weekly moving averages.
- Recent momentum signals turn mixed as overbought oscillators and mild pullback suggest short-term upside may be limited.
- Expected price range for the next week is $288 to $308, with consolidation likely unless a breakout triggers further directional movement.
Regulatory pressures in India offset by hedge fund inflows and revenue beat
Apple is under heightened regulatory scrutiny in India, as the Delhi High Court has ordered the company to fully cooperate with an antitrust investigation concerning its App Store policies, with potential exposure to a $38 billion penalty and a requirement to submit financial statements within two months. The court declined to suspend the proceedings while Apple challenges the regulatory framework, delaying the final ruling until mid-July. Despite this development, Apple continues to expand its market and manufacturing operations in India, while several hedge funds have increased their positions in AAPL following its record fiscal second-quarter revenue of $111.18 billion.
Technical momentum stays mixed to bullish amid persistent overbought signals
On the weekly chart, Apple remains in a structurally bullish setup, trading above all major moving averages, with the nearest dynamic support at the MA-20 ($264.57). Weekly momentum signs are mixed to positive: MACD indicates continued buying, ADX at 19.05 suggests the trend is present but not particularly strong, and several oscillators including the RSI (near 70), Commodity Channel Index, and Stochastic RSI all signal overbought conditions. Bull/Bear Power remains positive and overbought, confirming buyer dominance, while the Awesome Oscillator also supports the overall bullish tone. Weekly price action was contained within a 3.63% volatility band, with the current price sitting mid-range.
Consolidation favored for next week barring potential breakout scenarios
Looking ahead, the trading range for the next five trading days is anticipated between $288 and $308, based on current price action and weekly volatility. With 2 of 4 key indicators in Buy or Strong Buy territory, the balance of probabilities points to consolidation, as the price is expected to fluctuate between $288 and $308 unless a clear breakout occurs. A move above $308 would likely attract further bullish interest and push the stock toward new highs, while a sustained drop below $288 could trigger a deeper correction, with immediate technical support at $284 and the weekly MA-20 ($264) coming into focus.
Earlier, analysts noted that Apple’s stock was exhibiting continued strength while showing signs of overbought conditions and ongoing regulatory risk, particularly in India. With the latest developments amplifying both the company’s regulatory exposure and institutional interest, traders should closely monitor for a breakout above $308 or a sustained decline below $288 as signals for renewed momentum in either direction.


Latest Apple News


-
 Afghanistan
-
 Albania
-
 Algeria
-
 Angola
-
 Argentina
-
 Armenia
-
 Australia
-
 Austria
-
 Azerbaijan
-
 Bahamas
-
 Bahrain
-
 Bangladesh
-
 Belarus
-
 Belgium
-
 Bolivia
-
 Botswana
-
 Brazil
-
 Brunei
-
 Bulgaria
-
 Cambodia
-
 Cameroon
-
 Canada
-
 Chile
Chile
-
 China
China
-
 Colombia
-
 Congo
Congo
-
 Costa Rica
-
 Cote d'Ivoire
-
 Croatia
-
 Cuba
Cuba
-
 Cyprus
-
 Czechia
-
 DR Congo
-
 Denmark
-
 Dominican Republic
-
 Ecuador
-
 Egypt
Egypt
-
 El Salvador
-
 Estonia
-
 Eswatini
-
 Ethiopia
-
 Finland
-
 France
-
 Georgia
-
 Germany
-
 Ghana
Ghana
-
 Greece
-
 Haiti
Haiti
-
 Hong Kong
-
 Hungary
-
 India
India
-
 Indonesia
-
 Iran, Islamic republic
-
 Iraq
Iraq
-
 Ireland
-
 Israel
-
 Italy
Italy
-
 Jamaica
-
 Japan
Japan
-
 Jordan
-
 Kazakhstan
-
 Kenya
Kenya
-
 Korea
Korea
-
 Kuwait
-
 Kyrgyzstan
-
 Laos
Laos
-
 Latvia
-
 Lebanon
-
 Lesotho
-
 Libya
Libya
-
 Lithuania
-
 Luxembourg
-
 Madagascar
-
 Malaysia
-
 Malta
Malta
-
 Mauritius
-
 Mexico
-
 Moldova
-
 Mongolia
-
 Montenegro
-
 Morocco
-
 Mozambique
-
 Myanmar
-
 Namibia
-
 Nepal
Nepal
-
 Netherlands
-
 New Zealand
-
 Nigeria
-
 North Macedonia
-
 Norway
-
 Oman
Oman
-
 Pakistan
-
 Palestine
-
 Panama
-
 Papua New Guinea
-
 Paraguay
-
 Peru
Peru
-
 Philippines
-
 Poland
-
 Portugal
-
 Puerto Rico
-
 Qatar
Qatar
-
 Reunion
-
 Romania
-
 Rwanda
-
 Saudi Arabia
-
 Serbia
-
 Singapore
-
 Slovakia
-
 Slovenia
-
 Somalia
-
 South Africa
-
 Spain
Spain
-
 Sri Lanka
-
 Sweden
-
 Switzerland
-
 Syria
Syria
-
 Taiwan
-
 Tajikistan
-
 Tanzania
-
 Thailand
-
 Trinidad and Tobago
-
 Tunisia
-
 Turkey
-
 UAE
UAE
-
 Uganda
-
 Ukraine
-
 United Kingdom
-
United States
-
 Uruguay
-
 Uzbekistan
-
 Venezuela
-
 Vietnam
-
 Yemen
Yemen
-
 Zambia
-
 Zimbabwe
- Forex
- Crypto
