
Microsoft stock price forecast: $412–$432 range in focus as MSFT climbs 2.90%

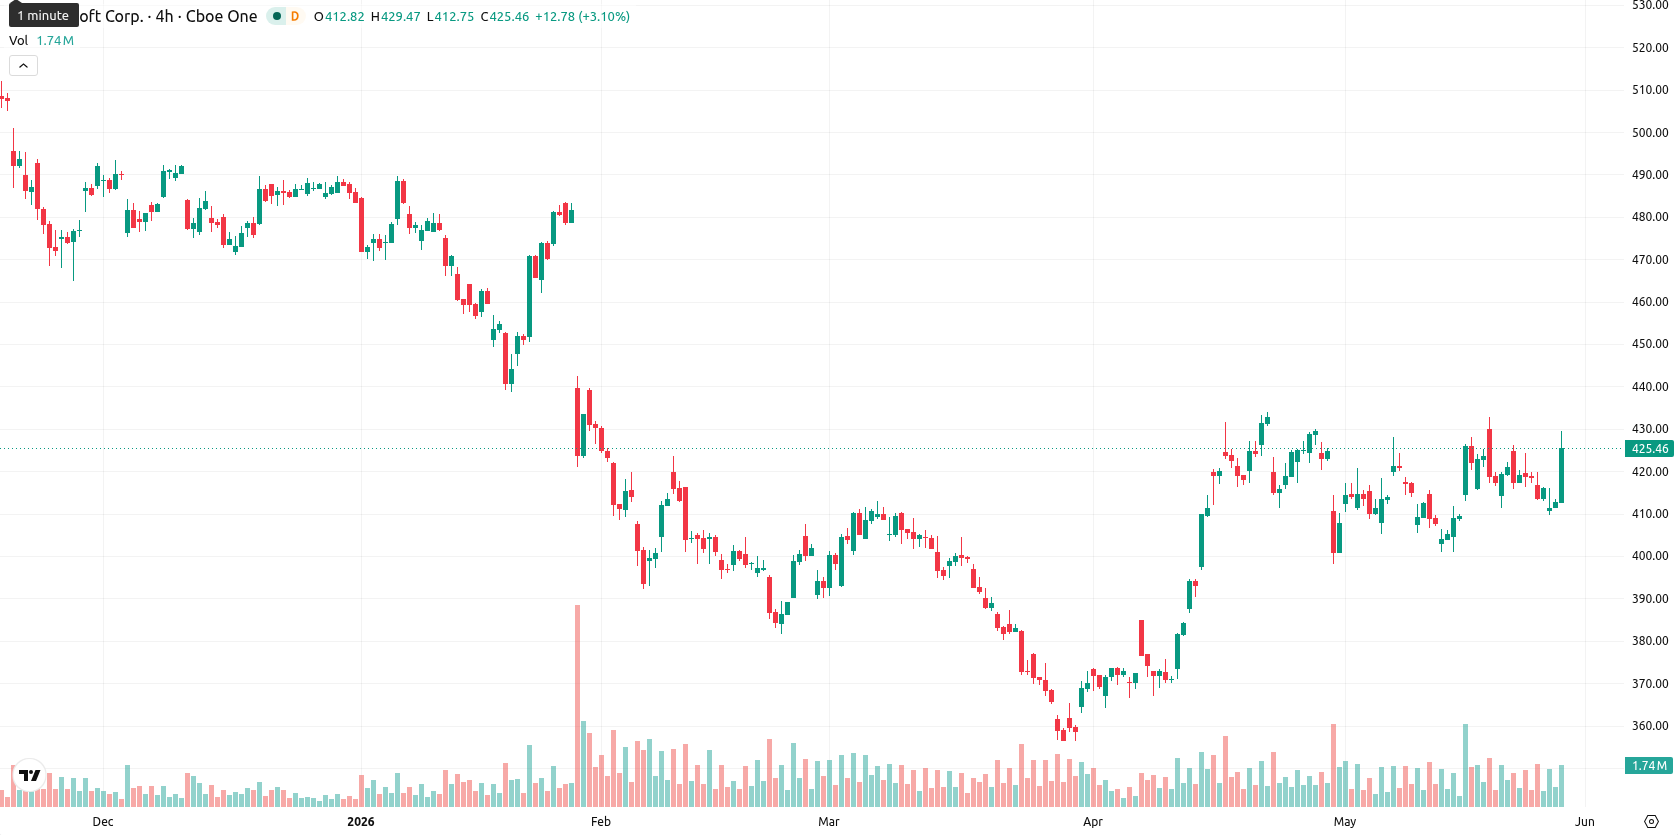
Microsoft Corporation (MSFT) stock is trading at $425.23 after rising 2.90% today, finishing above its key short- and medium-term moving averages. The current level places MSFT in strong territory compared to recent market action.
Highlights
- Microsoft secured a $9.69 billion, five-year Pentagon contract to unify software licenses across U.S. military and intelligence agencies.
- This deal significantly expands Microsoft's recurring revenue base and strengthens its institutional foothold in U.S. government markets.
- Technically, MSFT trades with short-term upward momentum but faces resistance within a $412–$432 range, with downside risk prevailing in the near term.
Expanded government contracts drive investor optimism and revenue visibility
Microsoft has been awarded a five-year, $9.69 billion agreement by the Pentagon to consolidate enterprise software licenses across multiple U.S. military and intelligence agencies. This landmark deal increases Microsoft’s contractual exposure to U.S. government procurement, supporting steady long-term revenue through expanded recurring streams and deepened institutional ties. Investors are reacting to the enhanced visibility and scale represented by the agreement, which significantly broadens Microsoft’s presence across critical government markets.
Divergent momentum and seller pressure as short-term support holds
On the technical side, MSFT is trading above the SMA-20 at $415.26 and SMA-50 at $401.06, but remains below the SMA-200 at $459.31. The Ichimoku Kijun (D1) offers nearby support at $415.86. A gap up occurred from yesterday’s close at $413.26 to today’s open at $417.30, with the stock currently close to session highs, reflecting robust intraday demand. Momentum indicators such as MACD (D1) issue a strong buy, while daily ADX signals a weak trend and BBP registers oversold at –0.37, highlighting persistent seller presence. RSI sits at 50.10 (buy), with Stoch RSI and CCI both neutral, and the Awesome Oscillator remains uncommitted. The divergence between firm daily momentum (MACD, RSI) and seller dominance (BBP), combined with neutral oscillators, introduces near-term vulnerability despite the upward drive.
Limited breakout odds as sideways consolidation expected
For the coming five sessions, MSFT is projected to fluctuate within the $412–$432 volatility band relative to current levels. The probability of a further upside move remains low (less than 20%), so a sideways consolidation within this range is the base case. A breakout above $432 could trigger new bullish momentum, while a fall below $412 would likely see the stock retest recent support. With key weekly signals still negative and only minor short-term upward momentum, traders should exercise caution.
Earlier, analysts noted that Microsoft’s operational momentum was underpinned by major AI partnerships and large-scale government contracts, despite mixed technical signals and market indecision. The current technical landscape, coupled with increased government exposure, adds near-term vulnerability and suggests traders should watch for a decisive move outside the $412–$432 range to identify a sustainable trend.


Latest Microsoft News


-
 Afghanistan
-
 Albania
-
 Algeria
-
 Angola
-
 Argentina
-
 Armenia
-
 Australia
-
 Austria
-
 Azerbaijan
-
 Bahamas
-
 Bahrain
-
 Bangladesh
-
 Belarus
-
 Belgium
-
 Bolivia
-
 Botswana
-
 Brazil
-
 Brunei
-
 Bulgaria
-
 Cambodia
-
 Cameroon
-
 Canada
-
 Chile
Chile
-
 China
China
-
 Colombia
-
 Congo
Congo
-
 Costa Rica
-
 Cote d'Ivoire
-
 Croatia
-
 Cuba
Cuba
-
 Cyprus
-
 Czechia
-
 DR Congo
-
 Denmark
-
 Dominican Republic
-
 Ecuador
-
 Egypt
Egypt
-
 El Salvador
-
 Estonia
-
 Eswatini
-
 Ethiopia
-
 Finland
-
 France
-
 Georgia
-
 Germany
-
 Ghana
Ghana
-
 Greece
-
 Haiti
Haiti
-
 Hong Kong
-
 Hungary
-
 India
India
-
 Indonesia
-
 Iran, Islamic republic
-
 Iraq
Iraq
-
 Ireland
-
 Israel
-
 Italy
Italy
-
 Jamaica
-
 Japan
Japan
-
 Jordan
-
 Kazakhstan
-
 Kenya
Kenya
-
 Korea
Korea
-
 Kuwait
-
 Kyrgyzstan
-
 Laos
Laos
-
 Latvia
-
 Lebanon
-
 Lesotho
-
 Libya
Libya
-
 Lithuania
-
 Luxembourg
-
 Madagascar
-
 Malaysia
-
 Malta
Malta
-
 Mauritius
-
 Mexico
-
 Moldova
-
 Mongolia
-
 Montenegro
-
 Morocco
-
 Mozambique
-
 Myanmar
-
 Namibia
-
 Nepal
Nepal
-
 Netherlands
-
 New Zealand
-
 Nigeria
-
 North Macedonia
-
 Norway
-
 Oman
Oman
-
 Pakistan
-
 Palestine
-
 Panama
-
 Papua New Guinea
-
 Paraguay
-
 Peru
Peru
-
 Philippines
-
 Poland
-
 Portugal
-
 Puerto Rico
-
 Qatar
Qatar
-
 Reunion
-
 Romania
-
 Rwanda
-
 Saudi Arabia
-
 Serbia
-
 Singapore
-
 Slovakia
-
 Slovenia
-
 Somalia
-
 South Africa
-
 Spain
Spain
-
 Sri Lanka
-
 Sweden
-
 Switzerland
-
 Syria
Syria
-
 Taiwan
-
 Tajikistan
-
 Tanzania
-
 Thailand
-
 Trinidad and Tobago
-
 Tunisia
-
 Turkey
-
 UAE
UAE
-
 Uganda
-
 Ukraine
-
 United Kingdom
-
United States
-
 Uruguay
-
 Uzbekistan
-
 Venezuela
-
 Vietnam
-
 Yemen
Yemen
-
 Zambia
-
 Zimbabwe
- Forex
- Crypto
