
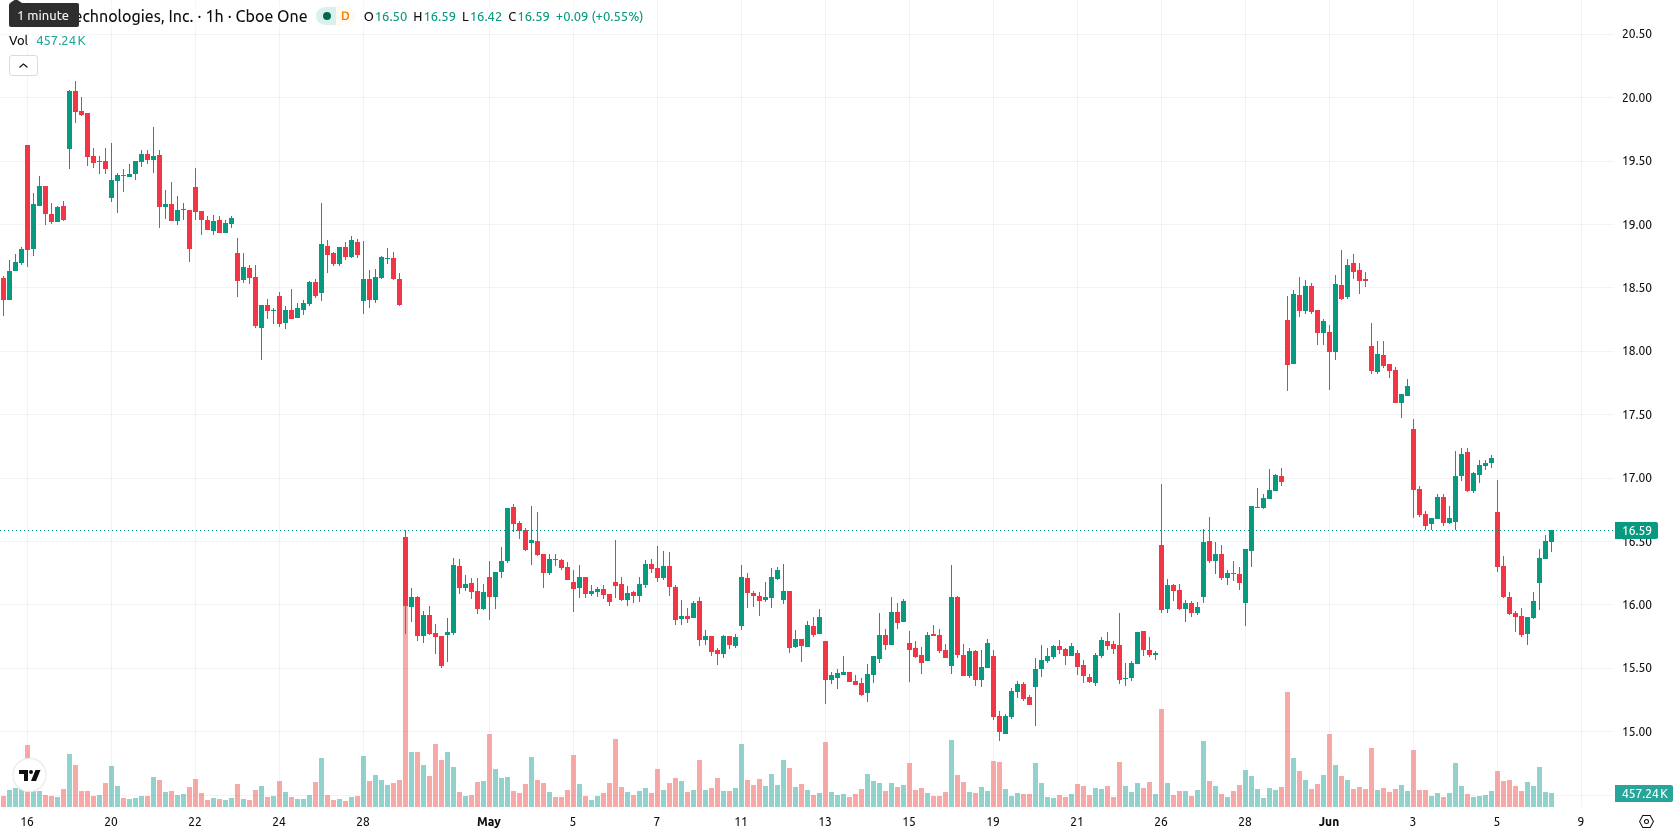
SoFi stock price forecast: $16.73 resistance as SOFI gains 3.95%

SoFi Technologies, Inc (SOFI) stock is trading at $16.59, rising 3.95% for the day. The stock is currently positioned above its key short-term moving average but remains below the mid- and long-term averages, indicating near-term buying but ongoing longer-term resistance.
Highlights
- SoFi Technologies launched SoFiUSD, a stablecoin enabling members to bridge traditional finance and blockchain assets within its app.
- Recent acquisitions of PrimaryBid assets and Peach Finance, plus executive hires and an AI coach, bolster SoFi's product suite and engagement.
- SOFI trades in a $15.45–$17.73 range with bearish technical momentum, 65% probability of downside, and resistance at $16.73.
Product expansion and acquisitions drive digital finance positioning
SoFi Technologies has expanded its product lineup with the official launch of SoFiUSD, a stablecoin now offered for buying, selling, holding, and conversion through the SoFi app. This move positions the company to capture additional demand from members interested in digital assets by providing a secure, bank-grade gateway between traditional finance and blockchain-based products. Recent strategic acquisitions, such as assets from PrimaryBid and the loan servicing platform Peach Finance, enhance SoFi's operational capabilities and technology reach. The company is also investing in leadership and innovation by appointing payments industry veteran Kathleen Pierce-Gilmore and unveiling an AI-powered financial coach, both expected to further increase customer engagement.
Mixed bearish momentum amid resistance at technical benchmarks
Technically, SOFI has moved above its 20-day moving average but remains constrained below the 50-day and 200-day levels. Immediate resistance is identified at the Ichimoku Kijun benchmark of $16.73, with key support recently established at $15.45. Momentum indicators convey a mixed to negative bias: the MACD signals Strong Sell, ADX remains in Sell mode, and RSI reads 46.28 (Sell), while the Stoch RSI is flagged as Overbought. CCI stands neutral, and the BBP shows prevailing buyer dominance, highlighting divergence between near-term price action and underlying bearish momentum.
Range trading likely as downside risk outweighs breakout odds
Over the next 2 to 3 trading days, SOFI is expected to remain within a volatility band of $15.45 to $17.73. There is a 35% probability for an upside move, while the likelihood of a downward move stands at 65%. The base case scenario calls for continued range-bound trading in this corridor. A decisive breach above the $16.73 resistance could trigger a bullish breakout, whereas a sustained drop below $15.45 support would favor a bearish scenario.
Earlier, analysts noted that SoFi was experiencing persistent selling pressure amid mixed technical signals and strategic digital expansion. The current analysis adds a fresh dimension by highlighting renewed short-term buying interest despite prevailing bearish momentum, with the next major move likely hinging on a confirmed break above $16.73 or below $15.45.


-
 Afghanistan
-
 Albania
-
 Algeria
-
 Angola
-
 Argentina
-
 Armenia
-
 Australia
-
 Austria
-
 Azerbaijan
-
 Bahamas
-
 Bahrain
-
 Bangladesh
-
 Belarus
-
 Belgium
-
 Bolivia
-
 Botswana
-
 Brazil
-
 Brunei
-
 Bulgaria
-
 Cambodia
-
 Cameroon
-
 Canada
-
 Chile
Chile
-
 China
China
-
 Colombia
-
 Congo
Congo
-
 Costa Rica
-
 Cote d'Ivoire
-
 Croatia
-
 Cuba
Cuba
-
 Cyprus
-
 Czechia
-
 DR Congo
-
 Denmark
-
 Dominican Republic
-
 Ecuador
-
 Egypt
Egypt
-
 El Salvador
-
 Estonia
-
 Eswatini
-
 Ethiopia
-
 Finland
-
 France
-
 Georgia
-
 Germany
-
 Ghana
Ghana
-
 Greece
-
 Haiti
Haiti
-
 Hong Kong
-
 Hungary
-
 India
India
-
 Indonesia
-
 Iran, Islamic republic
-
 Iraq
Iraq
-
 Ireland
-
 Israel
-
 Italy
Italy
-
 Jamaica
-
 Japan
Japan
-
 Jordan
-
 Kazakhstan
-
 Kenya
Kenya
-
 Korea
Korea
-
 Kuwait
-
 Kyrgyzstan
-
 Laos
Laos
-
 Latvia
-
 Lebanon
-
 Lesotho
-
 Libya
Libya
-
 Lithuania
-
 Luxembourg
-
 Madagascar
-
 Malaysia
-
 Malta
Malta
-
 Mauritius
-
 Mexico
-
 Moldova
-
 Mongolia
-
 Montenegro
-
 Morocco
-
 Mozambique
-
 Myanmar
-
 Namibia
-
 Nepal
Nepal
-
 Netherlands
-
 New Zealand
-
 Nigeria
-
 North Macedonia
-
 Norway
-
 Oman
Oman
-
 Pakistan
-
 Palestine
-
 Panama
-
 Papua New Guinea
-
 Paraguay
-
 Peru
Peru
-
 Philippines
-
 Poland
-
 Portugal
-
 Puerto Rico
-
 Qatar
Qatar
-
 Reunion
-
 Romania
-
 Rwanda
-
 Saudi Arabia
-
 Serbia
-
 Singapore
-
 Slovakia
-
 Slovenia
-
 Somalia
-
 South Africa
-
 Spain
Spain
-
 Sri Lanka
-
 Sweden
-
 Switzerland
-
 Syria
Syria
-
 Taiwan
-
 Tajikistan
-
 Tanzania
-
 Thailand
-
 Trinidad and Tobago
-
 Tunisia
-
 Turkey
-
 UAE
UAE
-
 Uganda
-
 Ukraine
-
 United Kingdom
-
United States
-
 Uruguay
-
 Uzbekistan
-
 Venezuela
-
 Vietnam
-
 Yemen
Yemen
-
 Zambia
-
 Zimbabwe
- Forex
- Crypto
